
If you've ever stared at a crypto chart and felt like your brain was about to melt trying to figure out what comes next, you are far from alone. Crypto charts are notoriously chaotic, you find the green and red candles shoot up and down like a heart monitor, and it's easy to feel like you're guessing more than you're actually analyzing. This is where moving averages come in, and to be honest, these tools are not magic, but they offer something very valuable, and that’s “clarity.” And when you're trading in a space as volatile as crypto, being able to identify a trend early can mean the difference between riding a wave and getting wrecked by it.
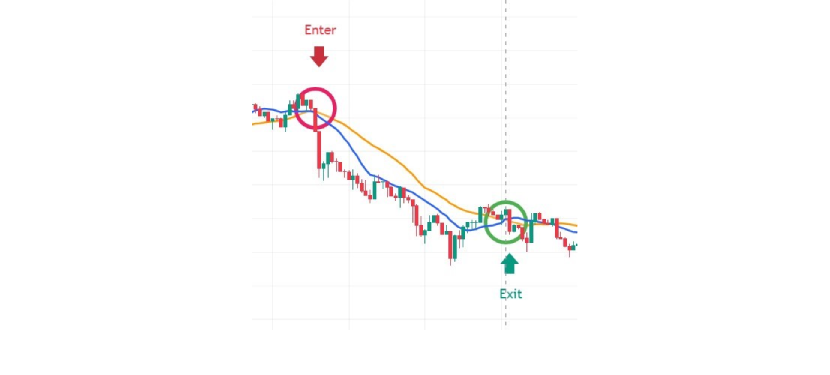
So, how to use moving averages in crypto? Set two moving averages based on the closing prices of the last 13 and 26 candles, open a position when one moving average crosses the second moving average, as it signals the start of a trend. Close the trade when they cross again in the opposite direction, signaling that the trend has reversed. When the 13-day SMA crosses above the 26-day SMA, it signals a buying opportunity because the short-term trend is gaining momentum, and when the 13-day SMA crosses below the 26-day SMA, it could signal the start of a downward trend, which is a good moment to sell.
Why the 13- and 26-Day Moving Averages Work
A lot of new traders think the more tools they stack on their charts, the better they’ll trade. They load up indicators, watch a few YouTube breakdowns, and hope something clicks, but after a few rough weeks in the market, it becomes clear, simple works better and that’s where the 13- and 26-day SMAs come in. The 13-day SMA reacts faster to price movement, which means it’s more sensitive to the short-term shifts that often precede bigger trends. It shows you the market's immediate momentum, the emotional side, if you will, and that’s the kind of price action that reflects trader reactions to news, hype, or sell-offs. On the flip side, the 26-day SMA is the cooler head in the room, it moves slower, which is exactly what makes it useful as it smooths out the noise. It’s not trying to show you what’s happening right now, it’s giving you a glimpse into the overall direction the market’s been leaning.
But it’s when these two moving averages cross that the real insight happens, when the 13-day SMA crosses above the 26-day SMA, it usually means buyers are in control and momentum is building, that’s your signal to consider a long position, and on the other hand, when the 13 crosses below the 26, it’s often a sign that the uptrend is fading or even reversing, and it might be time to tighten stops, exit, or go short depending on your strategy. In crypto, where volatility is high and things can turn on a dime, having a simple yet effective method to spot the beginning and end of a trend can save you from a lot of emotional trades and a lot of unnecessary losses, and when you combine this insight with a disciplined strategy, it becomes much easier to trade.
How to Set Up the 13- and 26-Day Simple Moving Averages on TradingView
Setting up moving averages on TradingView is a quick process once you get the hang of it. Here's a clear, beginner-friendly step to help you set up the 13-day and 26-day SMAs and start spotting trading signals with confidence.
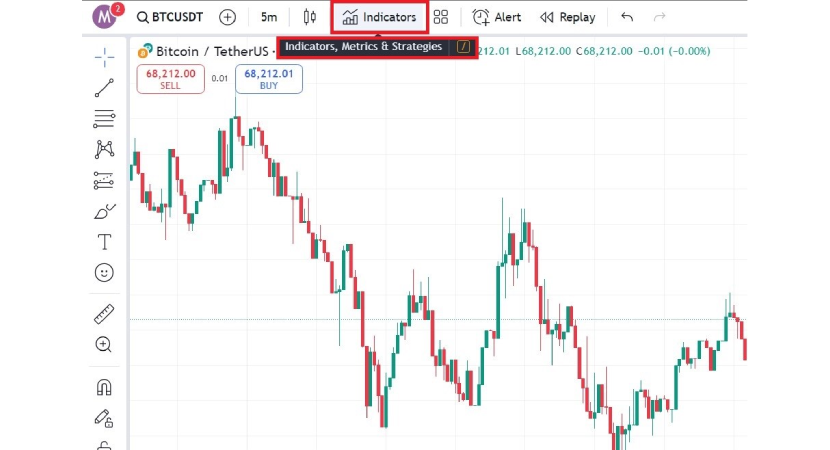
1. Open Your Chart and Access Indicators
First, pick the cryptocurrency you want to analyze: Bitcoin, Ethereum, or any altcoin you prefer. Open its chart on TradingView. At the top of the screen, click on the “Indicators” button, and this is where you’ll be able to search and add technical tools to your chart.
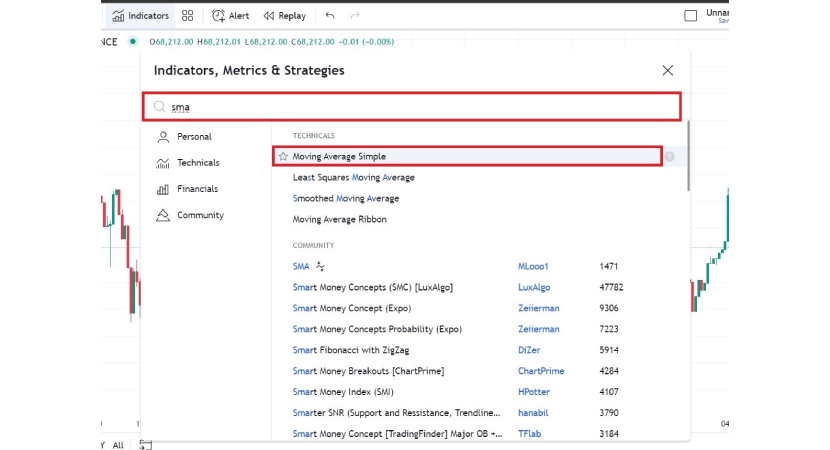
2. Add the SMA Indicator (Twice)
Inside the Indicators tab, type “SMA” into the search bar and select the Simple Moving Average option. Click it twice, because you’ll need to use two SMAs, one set to 13 and the other to 26.
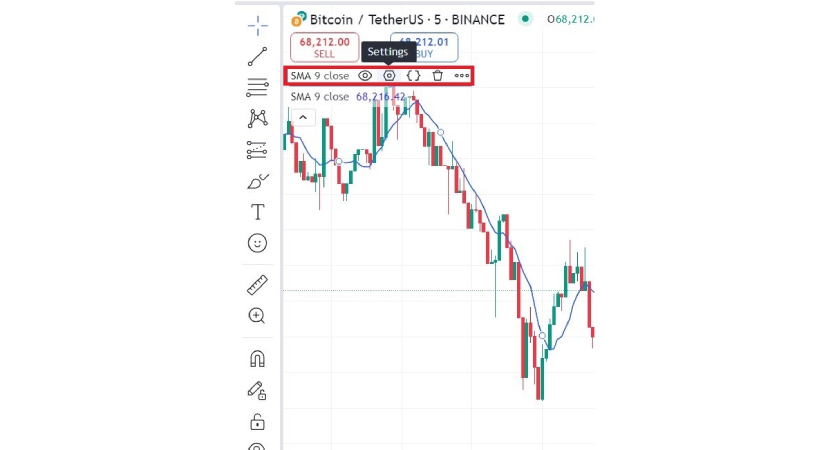
3. Customize the First SMA (13-Day)
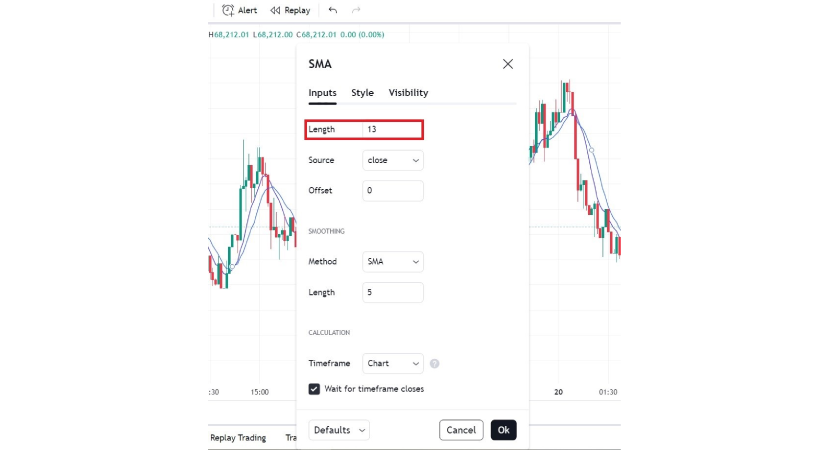
Now it’s time to set the first SMA to track the last 13 closing candles.
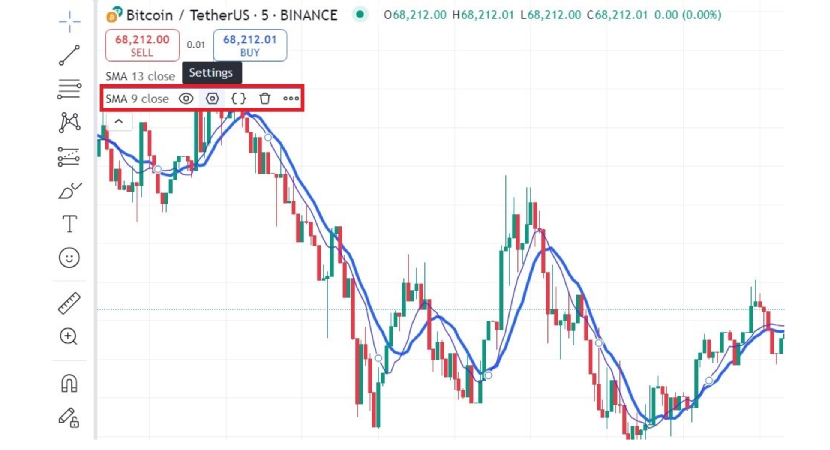
- Look at the top left of your chart. You should see a small label for your SMA.
- Click on it and then hit the gear icon (the settings button).
Inside the settings window:
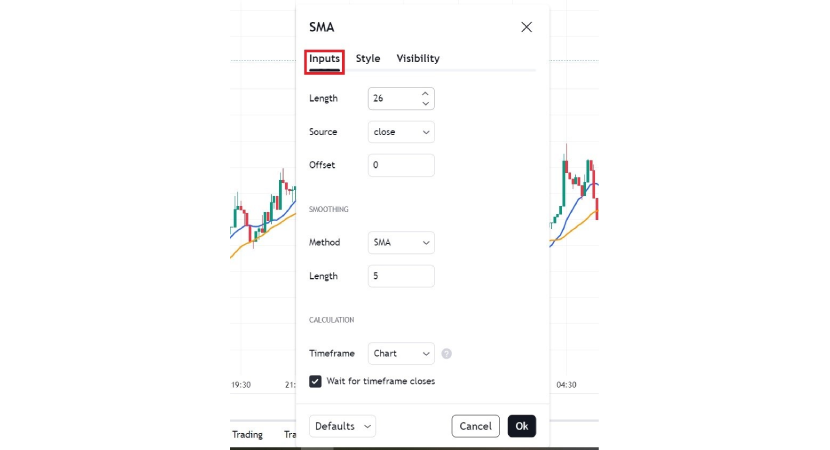
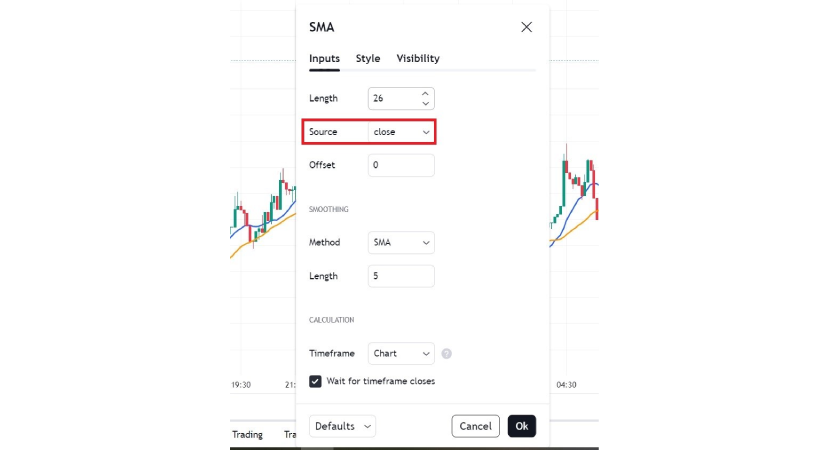
- Go to the Inputs tab
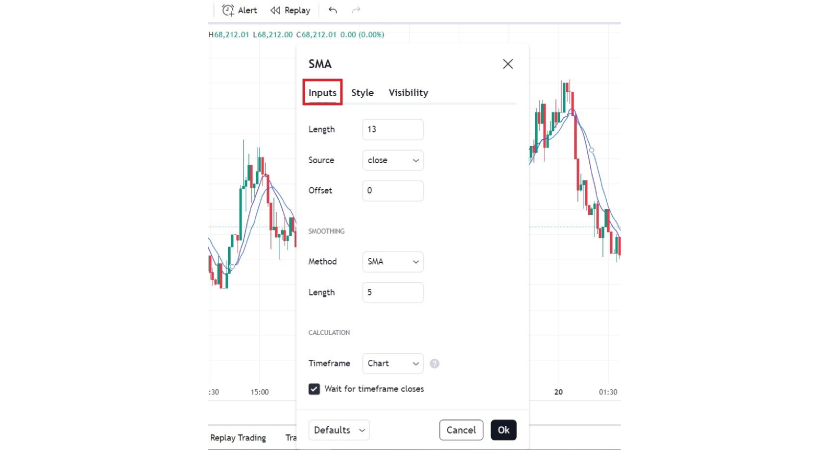
Change the Length to 13
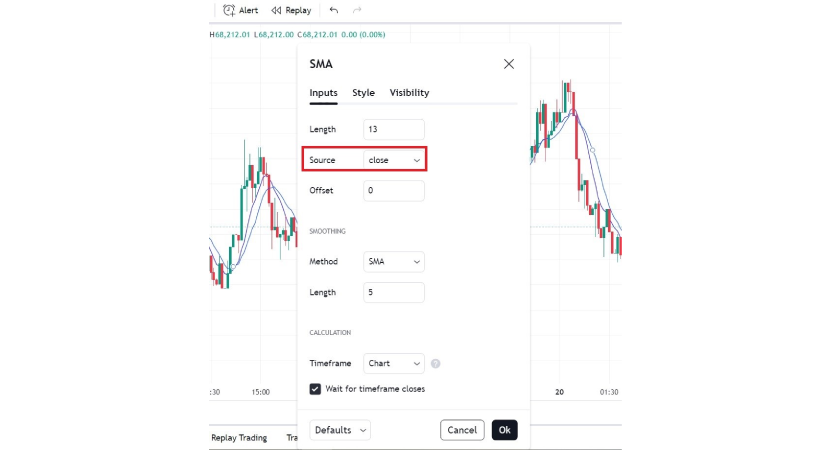
Make sure the Source is set to “Close.”
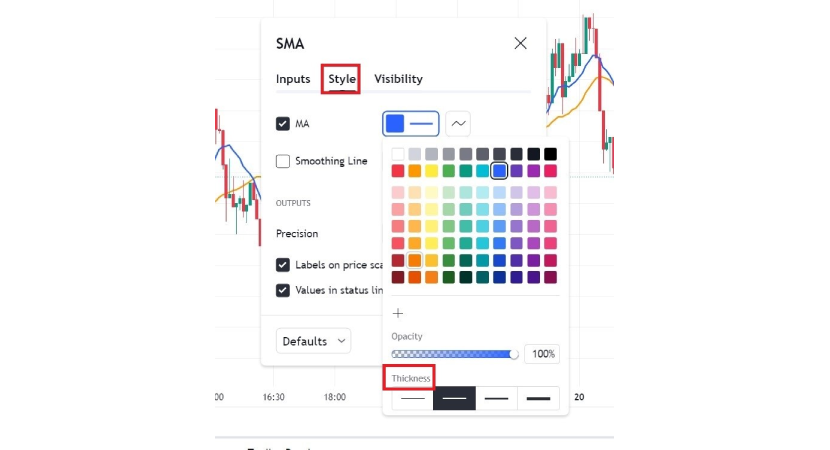
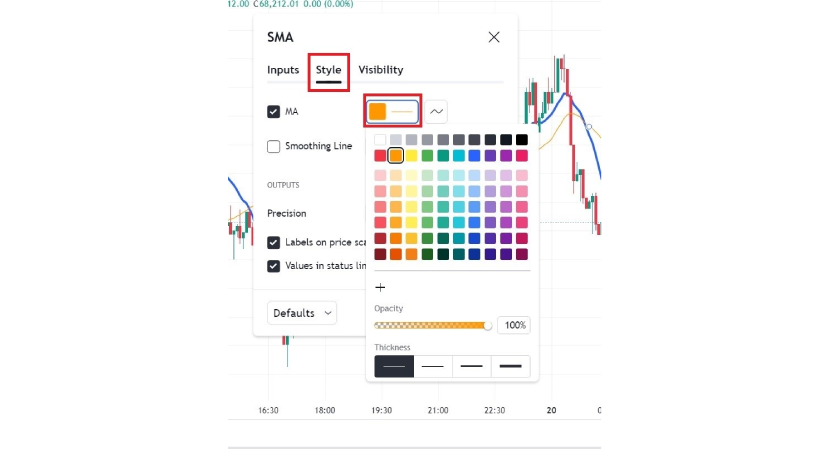
Now click over to the Style tab:
- Choose a color that stands out. In this guide, we’ll use blue for the 13-day SMA.
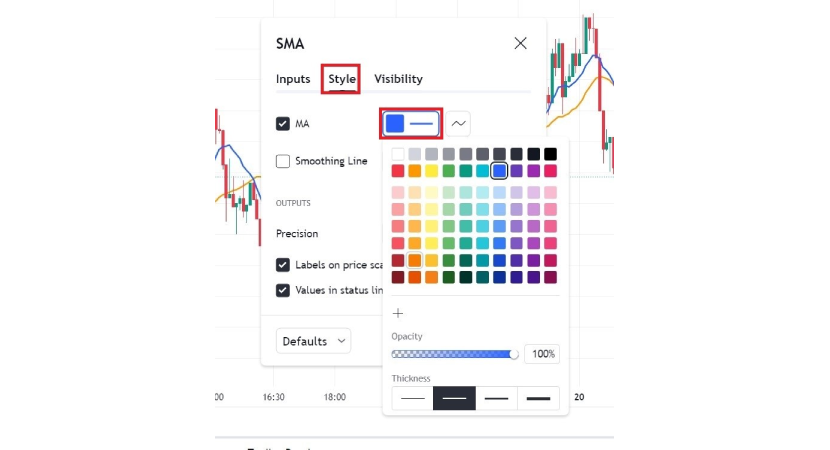
Adjust the thickness to make the line more visible.
4. Set Up the Second SMA (26-Day)
Now repeat the process for the second moving average, but this time set the length to 26.
- Click the other SMA label on your chart (usually just below the first)
- Open its settings using the gear icon.
In the Inputs tab:
Set the Length to 26
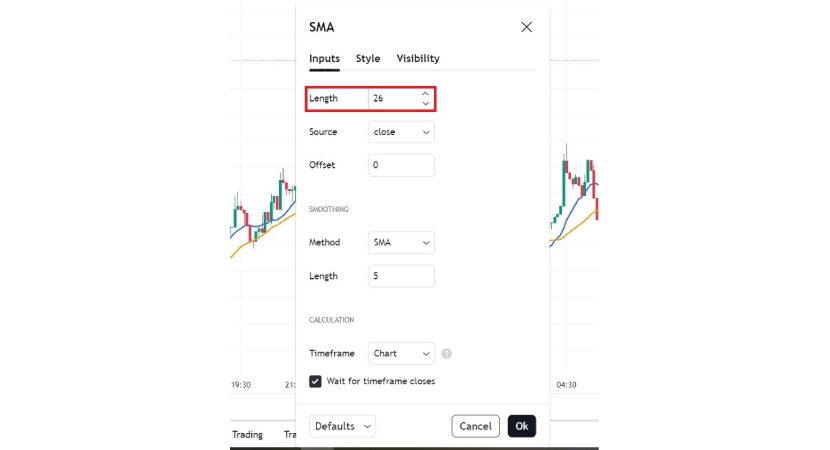
Keep the Source as “Close”
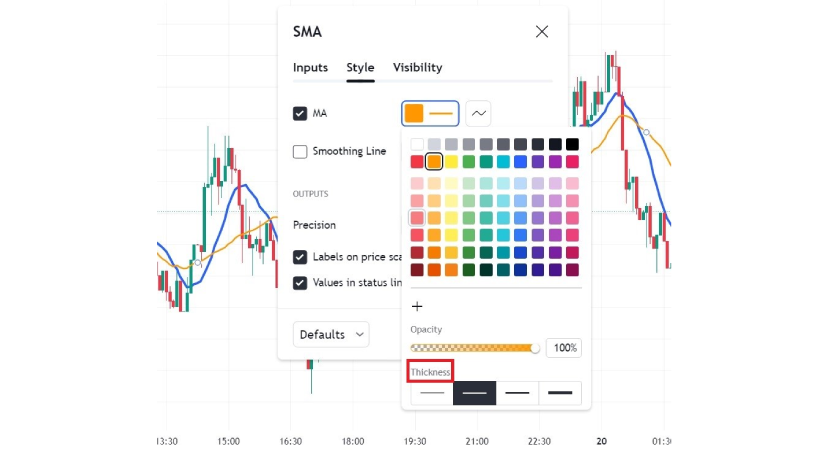
Under the Style tab:
- Pick a different color for easy comparison. In this case, we’ll use orange for the 26-day SMA.
You can adjust the thickness here as well.
Once you’ve got both the 13-day and 26-day SMAs set up, you’ll have a much clearer view of the market’s movements. The next step is getting comfortable with how these averages cross over each other, as that’s where you’ll start spotting the best trading opportunities.
How to Use the Crossovers
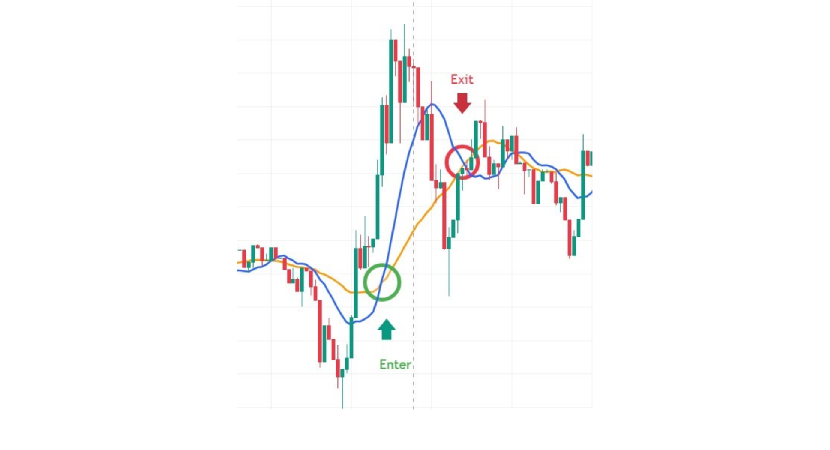
This is where the method becomes more than just lines on a chart, this is where you use those lines to make actual trading decisions. Now that you know how to set up moving averages in crypto, the next step is to focus on the crossover. This is when the short-term moving average (13 SMA) crosses either above or below the long-term moving average (26 SMA), signaling important changes in the market’s momentum.
When to Buy (Bullish Crossover)
When the 13-day SMA crosses above the 26-day SMA, it’s a sign that the short-term price movement is gaining strength. This kind of crossover suggests that buyers are stepping in, demand is increasing, and a new uptrend may be taking shape. It's often called a bullish crossover for a reason. Most traders open a long position here, riding the wave upward with the goal of exiting before the next reversal. But here's the thing, you shouldn't blindly enter just because the crossover happened, the context also matters:
- Is the overall market bullish?
- Are you trading in line with the higher time frame trend?
- Are there any resistance levels nearby that might block the move?
Use the crossover as a green light, but still check both ways before stepping on the gas.
When to Sell or Exit (Bearish Crossover)
If the 13-day SMA crosses below the 26-day SMA, that's usually your sign to sell or at least tighten your stop-loss. This move often signals that momentum is shifting to the downside, and sellers may start gaining control. In practice, this is where you see the rally slow down, volume taper off, and price begin to roll over. It's not always a "get out immediately" situation, especially if you're in a strong, long-term bull market, but it is a clear signal to reassess and maybe take partial profits, maybe exit completely, or maybe flip your bias to short if you trade both directions.
What Makes The Crossover Strategy So Successful?
What makes this crossover method powerful is that it's completely reactive, instead of predictive, you’re not trying to call the top or bottom, but instead you're waiting for price action to confirm a shift in trend. This is exactly how to use moving averages in crypto, by letting the indicators guide you rather than relying on guesswork, and it also helps reduce emotional decision-making, because you have a clear set of rules that you can follow. It's also simple, and in crypto, where complexity often backfires and over-analysis leads to paralysis, simple is good. This strategy won't catch every move, but it'll help you catch the big ones while avoiding the fakeouts, and if you combine it with good risk management and a clear trading plan, it can be incredibly effective.
The SMA vs. EMA vs. SMMA vs. VWMA
When traders talk about moving averages, they’re not all referring to the same thing since there are different types of moving averages, each with its own behavior and use cases, so before you dive headfirst into applying them to your crypto strategy, here’s a quick breakdown:
Simple Moving Average (SMA)
This is the most straightforward type of moving average. This indicator takes the closing prices of the last X number of candles and averages them out. So if it’s a 20-day SMA, it just adds up the last 20 daily closing prices and divides by 20. It gives you a clean, smoothed-out line that’s easy to read and helps you spot the general trend, but because it treats every candle equally, it reacts more slowly to recent price shifts, and that’s actually a good pick when you want to avoid reacting to short-term noise.
Exponential Moving Average (EMA)
Now we’re looking at a faster-moving average, the EMA also uses a set number of closing prices, but it gives more weight to the most recent ones. This makes the EMA more sensitive to price changes, which is why traders who want quicker signals, especially for short-term plays, tend to prefer this one. The downside? That same sensitivity can lead to more false signals during a ranging market.
Smoothed Moving Average (SMMA)
This moving average smooths out price movement even more by taking into account a much broader range of past data, and it updates more gradually. That makes it extremely useful for spotting long-term trends and filtering out volatility, it won’t give you early signals, but it can keep you in a good trend longer once that trend has started.
Volume-Weighted Moving Average (VWMA)
This one adds an extra layer by adding volume into it’s calculation. It doesn’t just look at price data but also factors in how much trading activity happened at each price, so if a big candle had a lot of volume, it carries more weight in the average. It is very helpful when you want to understand whether a move was just a quick spike or if it had real commitment behind it.
I’ve tested all of them: EMA, SMMA, and VWMA. The truth is, there’s no magic formula, some days, I’ll pair a fast EMA with a slow SMMA just to get a feel for both short-term momentum and longer-term confirmation, and it really depends on how reactive you want your system to be versus how many fakeouts you’re willing to tolerate. The great part is that the Platforms like TradingView make it easy to experiment, and if you’re using PlasBit’s tools to trade, you can map your indicators, execute quickly, and tweak your strategy in real time without overcomplicating it.
Understanding the 20-50-200 Day Moving Averages
Now let’s talk about a trio of moving averages that gets referenced a lot, not just in crypto, but in traditional markets too: the 20-day, 50-day, and 200-day moving averages. These numbers might seem arbitrary at first, but there’s actually some logic behind why so many traders pay attention to them. The 20-day moving average represents roughly one month of trading days, the 50-day MA shows about a quarter’s worth of price action, and the 200-day MA covers nearly an entire trading year (excluding November and December which tend to be months with very little trading). This setup originally came from the stock market, where weekends and holidays mean that only about 20 days out of the month are actually trading days.So in equities, these averages are used to track short, medium, and long-term sentiment in a very clean and structured way. But kicker is, Crypto trades 24/7, no weekends, no market holidays. So technically, the calendar logic behind these averages doesn’t fit perfectly.
But despite that, crypto traders still use these numbers, simply because they’re familiar and widely followed by others, like institutional traders, many of whom come from traditional finance, still base their decisions on these levels. If you look at a Bitcoin or Ethereum chart and use the 200-day moving average, you’ll often notice that the price respects it. It bounces from it in bull markets, and struggles to break above it in bear markets, and it’s not a coincidence but a calculated collective behavior. In my own experience, I’ve used the 50-day and 200-day combo to confirm trend direction on higher time frames. For example, if the price is above both and the 50-day is crossing upward through the 200-day, it’s often a strong bullish sign. If the price is below both, you want to be cautious about any long positions. That’s why many traders use these averages not to time entries, but to filter the type of trades they’ll consider, for instance, some traders will only take long trades when the price is above the 200-day moving average, while it’s not perfect, it can help you avoid trying to buy into a downtrend just because something looks "cheap."
What Is a Golden Cross in Crypto?
The golden cross is one of those terms that gets thrown around in trading circles like it’s some kind of magic spell, and to be honest, traders respect it for a good reason. So, what is a golden cross in crypto? It's a bullish chart pattern that creates a "cross" on the chart, signaling a buying entry point for traders when the 50-day moving average (short-term trend) crosses above the 200-day moving average (long-term trend). Traders see it as an indication of growing investor confidence and an upward trend. But what most people will not tell you is that a golden cross isn’t about predicting a move, it’s about confirming one. When that 50-day MA climbs above the 200-day, it usually means the market has already been recovering for a while, price has likely bottomed out, sentiment is shifting, and the upward momentum is gaining strength. The purpose is not to generate a get-in-early signal, but to confirm that the bulls are back in control. The golden cross works best when combined with other indicators like volume spikes, RSI, or MACD crossovers, and if you see all of these aligning, that’s when things get exciting.
Just remember that no pattern is bulletproof, golden crosses have failed before, and will fail again, especially in a ranging market. But in strong trending environments, they can be incredibly useful for building confidence in a long position or even just for avoiding the mistake of fighting the trend.
The Importance of Closing Prices on the Daily Time Frame
When you follow a chart during trading hours, it’s easy to get confused by all the noise, everything is happening very fast. But if there’s one number that matters most at the end of the day and it is the closing price, because that’s the price the market finally agrees on after all the noise, and as you will see, that’s not just some random technicality. Most big players, hedge funds, and institutions tend to make their decisions near the close. They’ve had all day to digest news, analyze price action, and place their orders. So when they make their move, it affects the closing price, and when it shifts meaningfully by the end of the day, it tells you something.
That’s why daily closes carry more authority than whatever happens in the middle of a Tuesday afternoon flash pump. Using moving averages based on closing prices means you are filtering out noise and factoring in an important clue about the direction of the market. In my experience, closing prices on the daily chart give the cleanest trend signals. When I switched to using SMAs based strictly on closes, I stopped getting chopped up by intraday noise and started seeing the bigger picture more clearly. You start noticing patterns, consistency and real momentum.
Which Moving Averages Are Best for Crypto Trading?
When it comes to trading indicators, there’s no one-size-fits-all, but there’s a reason why some moving averages are trusted more than others. If you're asking, Which moving averages are best for crypto trading? These are the 13 and 26 days moving averages, since the 13-day moving average reacts faster to price changes, it is helpful for understanding short-term trends and noticing when momentum shifts, while the 26-day moving average moves more slowly and gives a clearer view of the overall trend, helping to smooth out sharp spikes in prices and confirm where the market is heading in the long run.
These two averages work like a conversation between the short-term crowd and the long-term crowd, and when they agree, you’ve got something worth listening to. From my own trading experience, this combo cuts out the noise, however, I’ve seen countless setups where price teased a breakout, but it wasn’t until the 13 SMA broke past the 26 that things actually moved with conviction. So if you’re just starting out or even looking to clean up your chart, start with these two. They won’t give you 100% certainty, but they will give you structure, and structure, in a market like crypto, is everything.
What Are the Most Popular Moving Averages for Crypto Trading?
This one gets asked a lot, especially by newer traders trying to figure out which averages actually matter in the grand scheme of things. The truth is, popularity doesn’t always equal performance, but in this case, the crowd may be onto something. So, what are the most popular moving averages for crypto trading? The 50-day and 200-day moving averages are usually used to spot market trends and momentum, the 50-day shows medium-term direction, while the 200-day shows the long-term, and when the price is above both the trend is positive and the market is likely to move up, and when it is below both of them, the trend is negative and the market is likely to move down.
One thing I’ve noticed from my trades and from watching how others react is that the 200-day moving average can almost act like a psychological barrier, in bull markets it becomes the launchpad, while in bear markets it becomes the ceiling. Together, the 50- and 200-day MAs create a kind of trend framework. Many traders use the relationship between the two to gauge market conditions, and if the 50-day is above the 200-day, it’s a signal that the market is strong, and when it's below, that’s a sign of weakness. Simple, but incredibly effective when paired with volume and other tools.
Experiment, Adapt, and Build Your Strategy
The truth about moving averages? They’re only as good as the trader using them, because these tools become even more powerful once you understand how they interact with price, with volume, and with the emotional rollercoaster of a market as volatile as crypto. This is why knowing how to use moving averages in crypto effectively is essential, they help you navigate the market with a clear strategy. Whether you're just beginning your trading journey or you’ve already got a few war stories from past setups that didn’t quite go your way, moving averages offer a simple yet powerful strategy that keeps you grounded when the market starts to go haywire. You don't have to follow anyone else's playbook, try the 13/26 SMA strategy for momentum confirmation and add in the 50- or 200-day to get a long-term view, test the EMA if you want something more responsive, or the VWMA if you care about volume-backed moves. You can mix and match, tweak the periods, and most importantly, learn what works for your risk tolerance and your time horizon. This is all part of mastering how to use moving averages in crypto, by experimenting, adapting, and finding your unique approach.
At PlasBit, we believe technical tools like these should make things simple for you, not complicate them. We built our platform to be easy to use, simple to understand, and we provide easy to follow guides that explain everything in plain English so you can learn at your own pace. You can customize indicators on our exchange, study different setups, and track your trades with clarity. In the end, moving averages won't predict the future, but they make it easy to see if we’re in a bullish or bearish trend, and as the old saying goes, “the trend is your friend.” So all you have to do is just ride it.