

A moving average is a statistical method used to smooth data fluctuations and highlight trends by averaging data points over a specific period. You may wonder what is moving average in crypto? It's a technical analysis indicator that calculates the average of a crypto asset’s closing prices over a specific time frame and is displayed as a line on a graph, helping traders see the current and past market trends visually and smoothing out short-term price fluctuations. There are various types, including the Simple Moving Average (SMA), Exponential Moving Average (EMA), and Weighted Moving Average (WMA), each providing unique insights by differing in their calculation methods.
Moving averages provide benefits beyond trend identification; they also enforce trading discipline. Relying on these averages prevents emotional decision-making. Markets can behave unpredictably, and using unbiased tools helps maintain consistency, especially when market sentiment becomes volatile.
The core concepts of moving averages begin with an in-depth explanation of how these averages are calculated and can be used. We explore the different types of moving averages, including the SMA, EMA, WMA, and more advanced options like the Double Exponential Moving Average (DEMA). Learning about these tools can empower traders to better understand market trends.
A Detailed Look on Various Types of Moving Average
A moving average is a tool used in trading and technical analysis to smooth out price changes to find trends over a specified time period. This is because trends will become more visible as short-term market fluctuations get reduced. Moving averages allow traders to determine the general direction of an asset and thus make better judgment calls on when is a good time to buy or sell. Furthermore, cryptocurrency prices fluctuate a lot and often change dramatically in a short time. By using moving averages, traders can focus on the broader trend, allowing them to see whether prices are in an uptrend, downtrend, or going sideways.
Understanding what is moving average in crypto is crucial to reaching successful trading. Moving averages are essential to have a better insight of technical analysis. There exist various forms of moving averages which suit different trading styles. We did our research at PlasBit to provide you with an in-depth explanation of the most widely used moving averages, including Simple Moving Average (SMA), Exponential Moving Average (EMA), Weighted Moving Average (WMA), Double Exponential Moving Average (DEMA) and Kaufman’s Adaptive Moving Average (KAMA). In the following sections, we will examine them closely and also go over how they are calculated and why to use them.
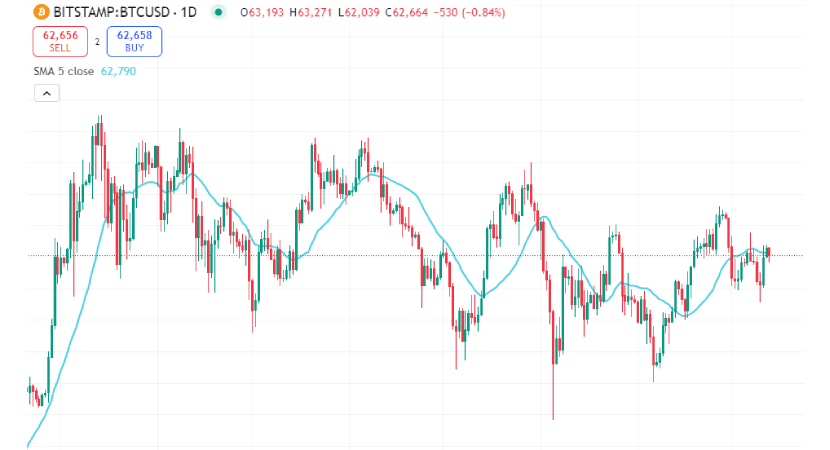
Simple Moving Average (SMA)
A Simple Moving Average (SMA) is the simplest type of moving average that exists. It finds the average price of a cryptocurrency over a given time. This could be 13, 26, or any other number of days. Traders can select the time frame depending on whether they are focused on short-term or long-term trends.
Why Use a Simple Moving Average?
The Simple Moving Average is popular because it gives a simple and easy-to-understand picture of price trends without the complexity of other indicators. You can identify trends by looking for a rising SMA, which indicates an uptrend, while a falling SMA points to a downtrend. You can also spot buy or sell signals because It can be a signal when the price has crossed above or below the SMA, indicating potential entry or exit points. For example, if the price increases above the SMA, it could be a good time to buy. Additionally, the SMA smooths out price fluctuations by, making it easier to visualize broader market trends. The SMA is very helpful for traders in assisting them to make informed decisions, and can be used as a trading filter in different strategies.
How Simple Moving Average (SMA) is Calculated:
Step 1
The first step is to pick how many days you want your average to include. Moving averages with shorter periods, like 5 days or 10 days, will respond more quickly to price changes, while longer-term moving averages use a larger time frame, like 100 days, and offer a broader view of trends.
Step 2
The closing prices of the asset within the selected time period, have to be collected. For example, if you want to compute a 5-day SMA for a cryptocurrency, you would check the closing prices of the asset for the past 5 days.
For example, let’s assume the closing prices for the last 5 days are:
- Day 1: $100
- Day 2: $105
- Day 3: $110
- Day 4: $115
- Day 5: $120
Step 3
Next, you add up the closing prices for each of those 5 days. Using our example:
100+105+110+115+120=550
Step 4
Once you have the total, divide it by the number of days in your time period. In this case, since we are calculating a 5-day SMA, you would divide the total by 5:
550÷5=110
So, the 5-day SMA is $110.
Step 5
This process is repeated every day, with the most recent closing prices being included in the calculation and older prices dropped off. Because of this, it is considered a "moving" average, constantly adjusting to the most recent prices. A continuous rising SMA implies an uptrend, and a continually falling one means a downtrend.
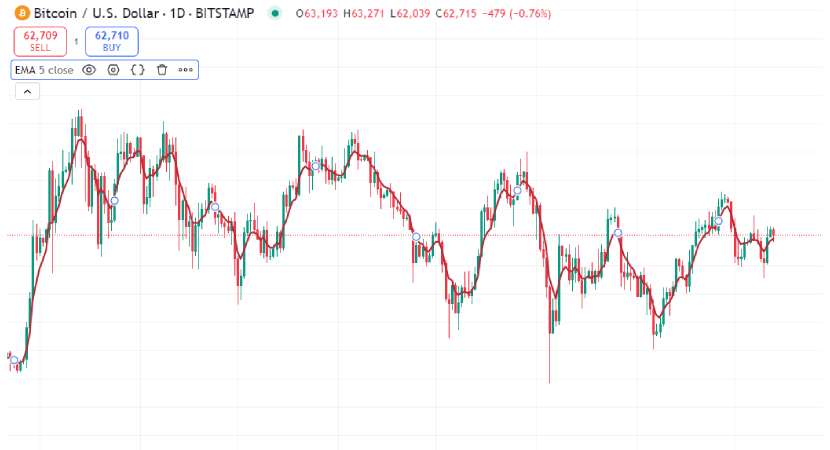
Exponential Moving Average (EMA)
The Exponential Moving Average (EMA) gives more weight to recent prices, making it respond faster to price changes. This is done by multiplying the latest price and adding it to the previous EMA value. The multiplier is based on a specific period and amplifies the weight of recent data points. For example, in a 5-day average, today's price has more influence on the EMA than the price from yesterday.
Why Use an Exponential Moving Average?
The primary benefit of the EMA is its responsiveness. Because it reacts more quickly to price changes than the SMA, traders often use it to capture short-term trends or signals in fast-moving markets. This makes the EMA particularly useful in volatile markets like cryptocurrency, where prices can change rapidly within short periods.
Yet, the EMA can be a little too quick, and in markets where prices move up and down frequently, it may generate too many false signals. This sensitivity can cause traders to act on small price movements instead of focusing on larger trends.
How Exponential Moving Average (EMA) is Calculated:
Let’s use the same prices $100, $105, $110, $115, and $120, and calculate the 5-day EMA.
Step 1
Calculate the SMA for the first 5 days as a starting point for the EMA.
- We already calculated the SMA to be $110.
Step 2
Calculate the EMA multiplier. The multiplier is what gives more weight to the latest price. For a 5-day EMA, the multiplier is calculated like this:
- First, add 1 to the number of days (5): 5+1=6
- Then, divide 2 by this result: 2÷6= 0.333
So, the multiplier is 0.333. This means that 33.3% of the weight will be given to the most recent price (Day 5), and the rest (66.7%) will be given to earlier 4 days prices.
Step 3
Calculate the EMA for Day 5. Now we apply the multiplier to the latest price (Day 5) and the previous EMA which, for the first calculation, is the SMA from Step 1.
- Multiply the latest price (Day 5: $120) by the multiplier: 120×0.333=39.96
- Multiply the previous EMA (which for Day 5 is the SMA: $110) by the remaining weight (1 - 0.333 = 0.667)
110×0.667=73.37
Step 4
Add the two results together to get the EMA for Day 5:
- $39.96 + $73.37 = $113.33
So, the EMA for Day 5 is $113.33. The EMA is higher than the SMA because it responds more quickly to the latest price of $120, making it a better tool for short-term trend analysis.
In this chart, EMA is represented with the red line.
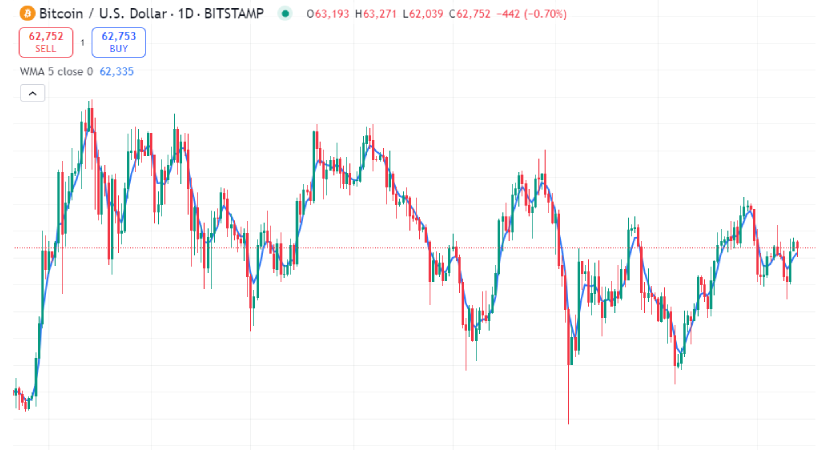
Weighted Moving Average (WMA)
Similar to the Exponential Moving Average (EMA), The Weighted Moving Average (WMA) gives more weight to newer prices. The WMA goes a step beyond this, though; it actually has a weight assigned to each price in the range of data. Previous prices are given the least consideration, and newer fees carry maximum weight. The WMA is calculated by taking each closing price multiplied with a weight (weight differs according to how recent the price was) and then dividing all of that over the sum of weights.
Why Use a Weighted Moving Average?
The WMA focuses on recent price movements more directly, making its reactions to real-time shifts fast. This makes it a faster moving average compared to the other types and helps traders in detecting quick opportunities or reversals. The WMA can be a useful trading indicator for traders who are working in rapidly changing markets with violent price swings.
A disadvantage of the WMA is that it overweight recent price; hence, in volatile markets can result in over-trading. In slow markets, this reactivity can cause false signals, which may push traders to act based on small fluctuations rather than the real market data.
How Weighted Moving Average (WMA) is Calculated:
We’ll use the same prices ($100, $105, $110, $115, and $120).
Step 1
Assign weights to each price.
- Day 5 (most recent) gets a weight of 5.
- Day 4 gets a weight of 4.
- Day 3 gets a weight of 3.
- Day 2 gets a weight of 2.
- Day 1 (oldest) gets a weight of 1.
Step 2
Multiply each price by its assigned weight.
- Day 5: $120 × 5 = $600
- Day 4: $115 × 4 = $460
- Day 3: $110 × 3 = $330
- Day 2: $105 × 2 = $210
- Day 1: $100 × 1 = $100
Step 3
Add up all the weighted values.
- $600 + $460 + $330 + $210 + $100 = $1,700
Step 4
Add up the weights (5 + 4 + 3 + 2 + 1 = 15).
Step 5
Divide the total weighted value by the sum of the weights:
- $1,700 ÷ 15 = $113.33
So, the WMA is $113.33, which is closer to the more recent prices than the SMA. This shows how the WMA reacts more quickly to recent price changes.
In the picture below you can see an example of WMA shown by the blue line
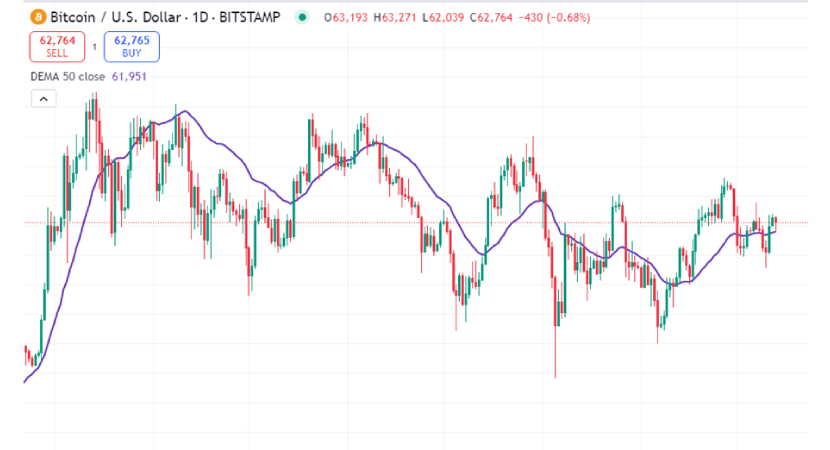
Double Exponential Moving Average (DEMA)
The Double Exponential Moving Average (DEMA) is designed to eliminate the lag in both the SMA and EMA. This is measured by using an EMA of an EMA, which uses the formula twice. So, it generates a faster average that reacts quicker to price movements while still filtering out some of the fluctuations.
Why Use a Double Exponential Moving Average?
One of the biggest advantages of the DEMA is its ability to reduce lag. Because it reacts faster to price changes than both the SMA and EMA, the quick response of the DEMA to price changes makes it essential for markets where speed is critical, such as markets that experience strong uptrends or downtrends. This allows traders to make quicker decisions and get in trends earlier.
However, the DEMA calculation can be quite complex for novice traders. While it provides faster signals, it is difficult to use manually and is usually calculated by charting applications.
How Double Exponential Moving Average (DEMA) is Calculated:
Let’s continue with the EMA we calculated earlier for Day 5, which was $113.33.
Step 1
Calculate the first EMA (already done as $113.33 for Day 5).
Step 2
Now calculate a second EMA, this time using the first EMA value.
- Multiply the Day 5 EMA ($113.33) by the same multiplier (0.333): 113.33×0.333=37.73
- Let’s assume the second EMA for Day 4 was $112. Multiply this by the remaining weight (0.667): 112×0.667=74.71
Step 3
Add these two results together to get the DEMA for Day 5:
- $37.73 + $74.71 = $112.44
So, the DEMA for Day 5 is $112.44. This result reacts more quickly to price changes than the regular EMA, making it useful for traders who need fast signals in fast-moving markets.
The purple line in the chart below is an example of DEMA used in a price chart.
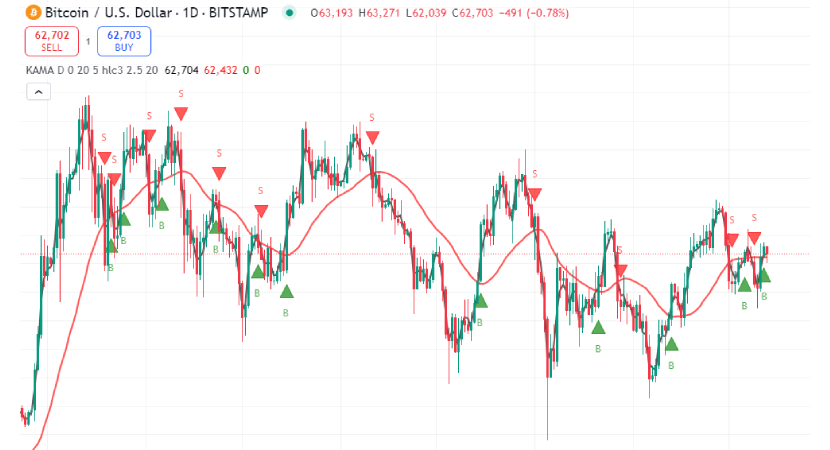
Kaufman’s Adaptive Moving Average (KAMA)
Kaufman's Adaptive Moving Average (KAMA) adapts to market volatility. KAMA moves more slowly when the market is calm and prices are stable. It incorporates an "efficiency ratio" which shows how robust price moves are while considering the market fluctuations. The KAMA sensitivity is continually adapting to potential price movement, stable when prices are steady, and then reacting quickly with an acceleration in trends.
Why Use a Kaufman’s Adaptive Moving Average?
Its main advantage is the adaptability to any trend. This enables it to decrease false signals during less volatile periods by adjusting its speed and becoming more responsive when the market is volatile. Making this tool especially valuable in fast-moving markets, where adapting to changing conditions is a must.
However, using this tool is a multistep process and also needs more knowledge of to interpret and understand. That complexity makes it not beginner-friendly or suited for those looking for a straightforward tool.
How Kaufman’s Adaptive Moving Average (KAMA) is Calculated:
Let’s assume the price of a cryptocurrency moved from $100 to $120 over 10 days, but the market was very volatile, with lots of ups and downs along the way.
Step 1
KAMA first looks at how much the price has moved overall (from $100 to $120 = $20 change).
- The net price change is $20.
Step 2
Next, KAMA measures the total price fluctuation over those 10 days. Let’s say the price fluctuated by $30 in total (the sum of all the small ups and downs).
Step 3
KAMA compares the $20 net change to the $30 fluctuation. If the market has been fluctuating but the price has only changed a little, KAMA moves slowly. But if the price is moving rapidly (like in this case), KAMA will become more responsive. So, in this volatile market, KAMA would react quickly to capture the overall trend.
Just by learning about such technical indicators and understanding what is moving average in crypto, you do not reach success automatically. You still should choose the best strategy based on your trading style, balancing simplicity with responsiveness.
The Kaufman’s Adaptive Moving Average is represented by the red line in the chart below.
Identifying Trends and Opening Trades Using Two SMA
In this guide we will look at how you can use two Simple Moving Average (SMA) together to identify trends and locate optimal entry-exit points for trades.
Setting Up Two Simple Moving Averages
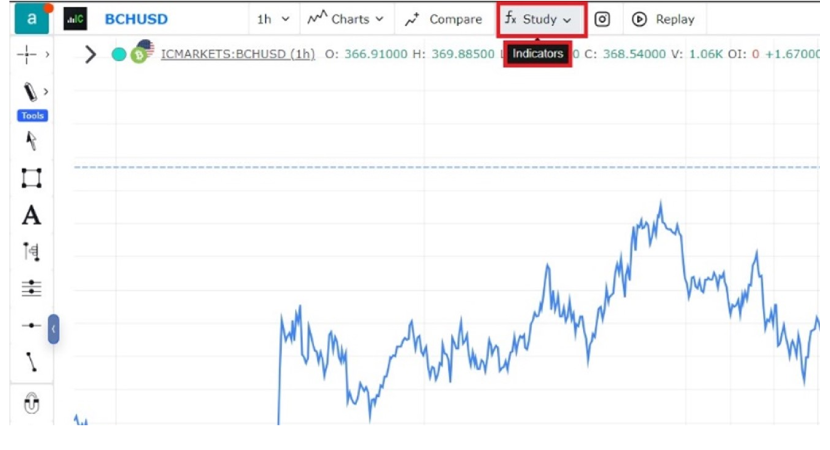
Access the Indicators Tab
Open your trading platform and navigate to the chart of the asset you want to analyze. Look for the "Indicators" tab, which is usually located at the top of the chart area or through a toolbar.
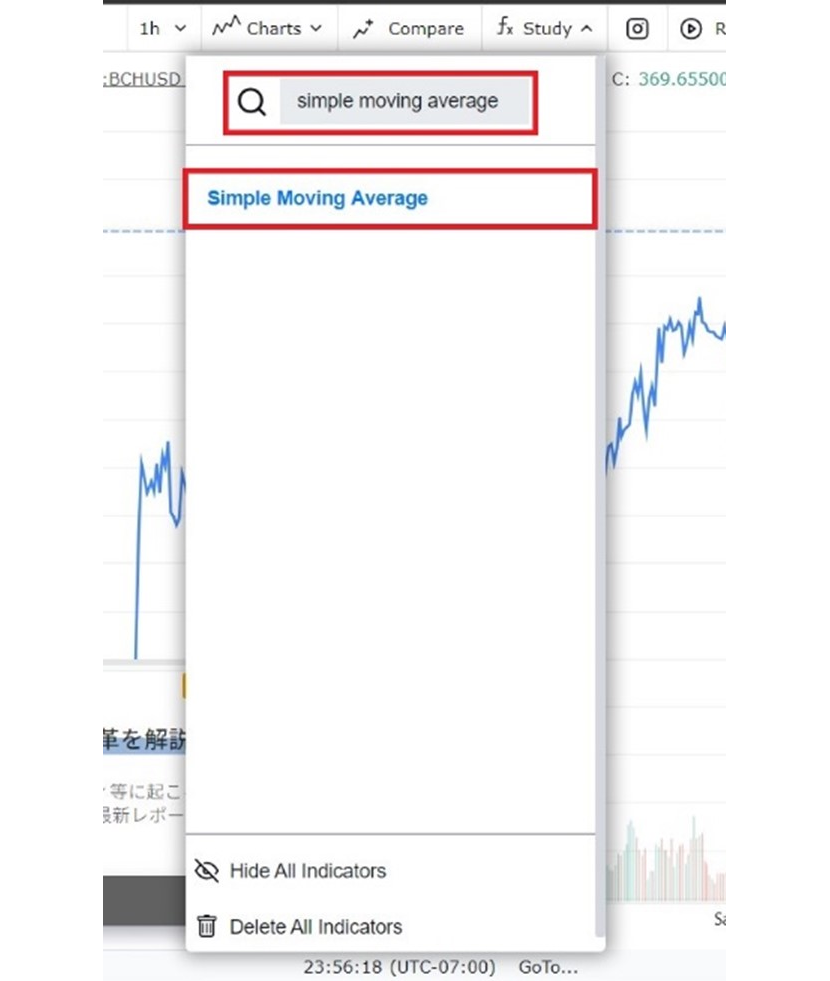
Add Simple Moving Averages
In the indicators search box, type "Simple Moving Average" or "SMA". Click to add the SMA to your chart twice since you'll be using two different SMAs.
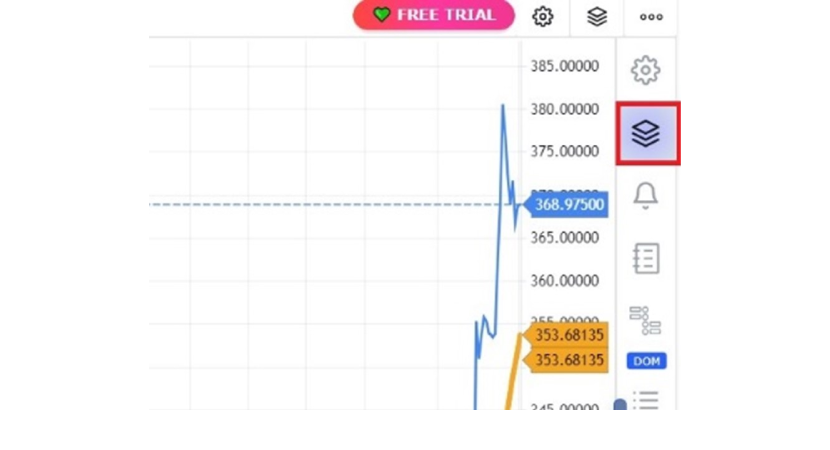
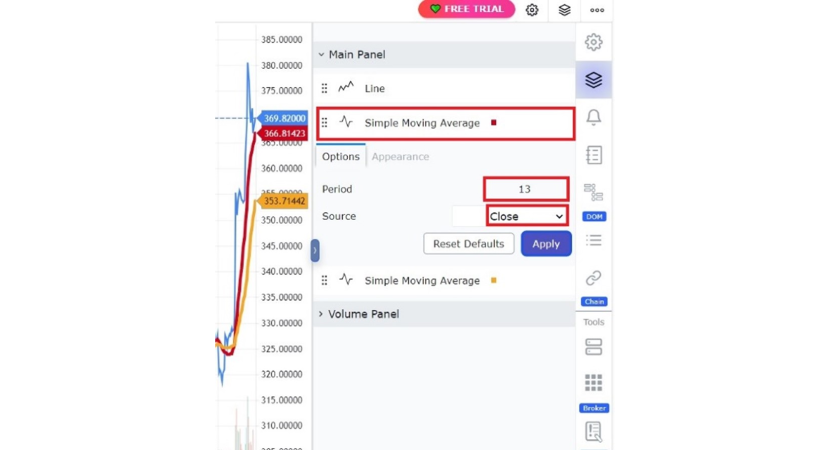
Find the Indicators Setting
Find and click on the settings or properties icon and find the indicators setting.
Configure the Moving Averages
Find the first SMA indicator you added. Set the length or period to 13. This will be your faster moving average and more responsive to price changes.
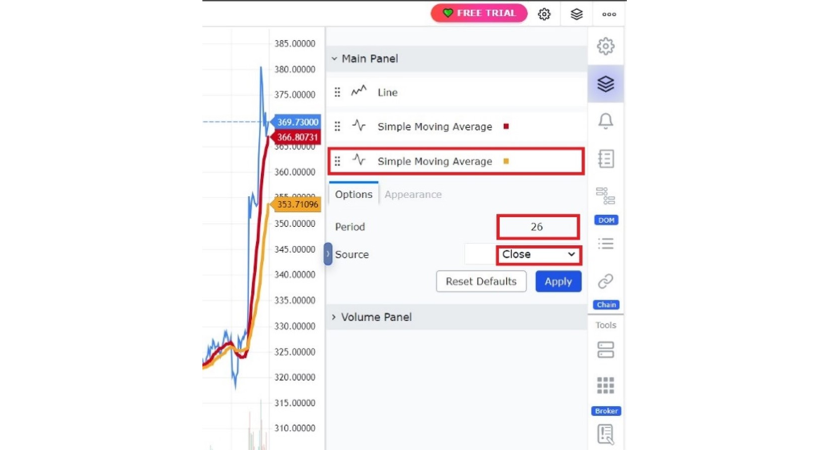
Repeat the process for the second SMA but set its period to 26. This is your slower-moving average.
Recognizing a Trend and Opening a Trade with SMA Crossovers
The basic premise of using two SMAs is to look for crossover points where the faster SMA (13) crosses, the slower SMA (26).
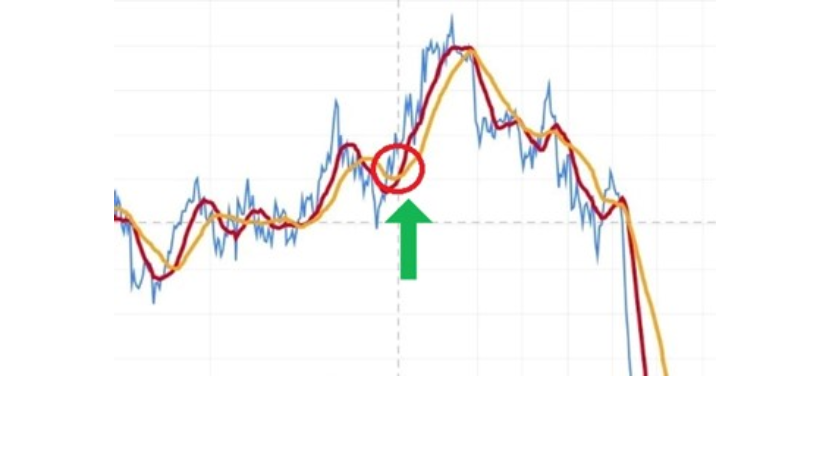
Bullish Signal
When the 13-period SMA crosses from below and goes above the 26-period SMA, it suggests that short-term momentum is rising and points to a potential upward trend. The bullish crossover is a signal of momentum that potentially marks the beginning of a positive change in price. This is often perceived by traders as a signal to open a buy position where they expect the price to rise further.
For example, in the BCH/USD chart below, the red line which represents the 13-day SMA, crosses the orange line, representing the 26-day SMA on 26 September 2024. It crosses from below and goes above, and after this crossing, an uptrend can be seen.
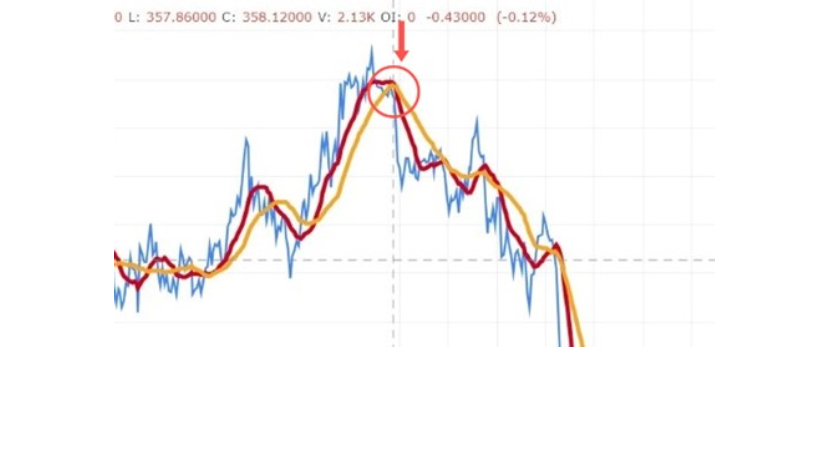
Bearish Signal
Conversely, if the 13-period SMA crosses from above and goes below the 26-period SMA, it suggests a potential downward trend. This bearish crossover indicates that short-term momentum is beginning to weaken, and the price of crypto could fall. This type of situation would be the perfect moment to think about entering a short position as the crossover signals a further decline in price.
In the chart below, you can see several instances where the 13-day SMA, represented by the red line, crosses the 26-day SMA which is shown by the orange line. One of such crosses happens on 27 September 2024, which is followed by an immediate downtrend.
Considerations Before Trading
Always confirm the trend before acting on a crossover signal to avoid chasing false signals. When volume increases during a trend, it is a strong indication that the trend will continue. You can also use the Relative Strength Index (RSI) to check if the market is overbought or oversold, adding an extra layer of confirmation for the trend's strength.
Opening a Trade
When a crossover is confirmed, and the trend is supported by other indicators or market conditions, consider entering the trade. You can use the momentum by entering close to the crossover. Be ready for scenarios where the market moves against your prediction, and apply stop-loss orders to reduce potential losses.
Monitoring the Crossovers
Once you entered the trade, keep looking at your chart for another crossover. Because if a crossover happens in the opposite direction, then it may indicate a trend reversal. And that would be the signal for you to exit your trade.
Using SMA crossovers can be an effective strategy, especially in trending markets. But you should practice this method in a demo account before using it for live trades to realistically know how effective it is, and if it goes well with your overall trading strategy.

Conclusion
Knowing what is moving average in crypto and how it works while being able to use it effectively could really make a difference. You can get a better view of the long-term trend and still be able to rapidly react against short-term price movements by using different moving averages for different situations. The crossover strategy we discussed, if executed correctly, can easily provide you with a powerful tool for navigating the volatile crypto markets by pinpointing both where to enter and exit. As always, also make sure to validate trends with other signals so you can trade wisely.
Additionally, as we touched on before, moving averages also assist traders in managing risk more effectively. You can identify trend reversals and major crossover points that will let you set up better stop-loss levels, as well as take-profit levels. This way, you can manage risk proactively, preventing yourself from being on the wrong side of price movements while also not missing profitable opportunities. This is why moving averages serve as both a tool for protection and analysis.
At PlasBit, we aim to equip traders with accurate insights and tools so that they can navigate the world of crypto effectively. With the right approach, moving averages can become an essential part of your trading strategy that helps you make better trading decisions, increasing your rate of profitable trades.