
Many beginner traders find technical indicators confusing when they first start using them. A common question they ask is how to use moving average in crypto trading? You need to set two moving averages calculated on the closing rates of the last 13 and 26 candles and look for when they cross each other to identify the entry point and close the trade when they cross again, meaning the trend flipped. If the 13-day SMA crosses above the 26-day SMA, it signals a good time to buy, as the short-term trend is gaining momentum. If the 13-day SMA crosses below the 26-day SMA, it suggests a downtrend is starting, making it a good time to sell.
Learning about technical indicators such as moving averages is a good first step toward designing an intelligent trading strategy. While the cryptocurrency market can be unpredictable and challenging, understanding these tools is the first step necessary to make more informed decisions.
This PlasBit article should help you in the practical application of Simple Moving Averages (SMA) in cryptocurrency trading. We will demonstrate adding two Simple Moving Averages, 13 and 26 periods, to your chart and show when the crossover of these lines provides buying or selling opportunities. The guide also includes using a single SMA (20-period) to find short-term price movement.
Set Up Simple Moving Averages for Crypto Trading
Here is a step-by-step guide on how to use moving average in crypto trading. With the help of moving averages, you can easily monitor price trends and note potential buy or sell crypto signals that occur at crossover points between 2 SMA lines.
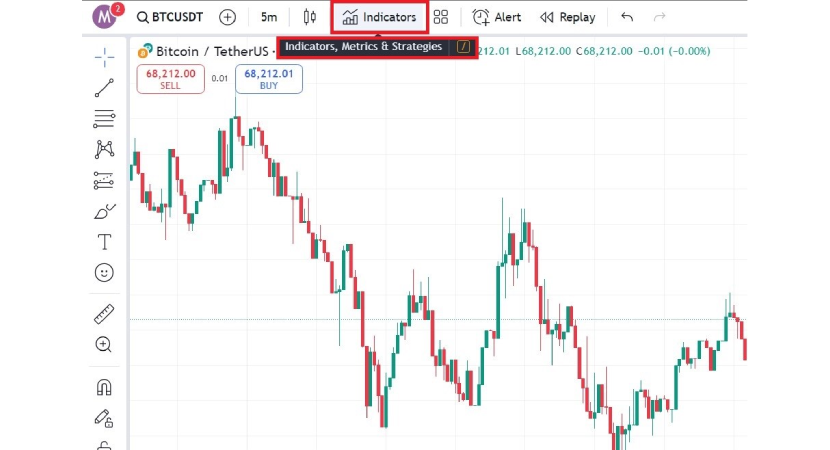
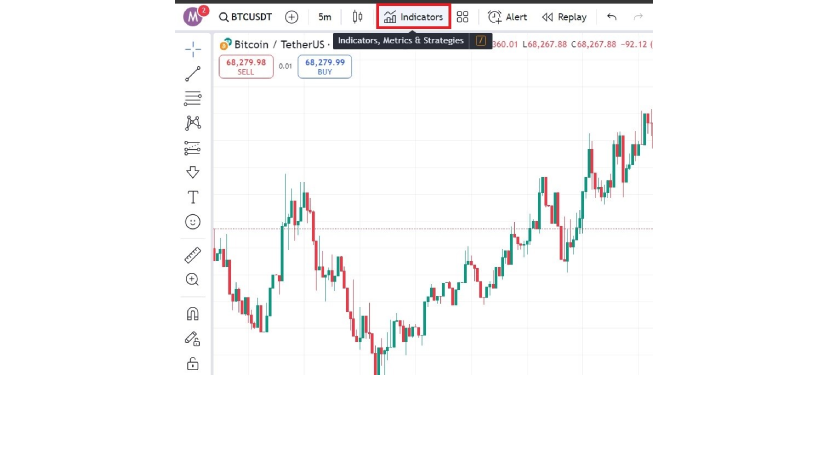
1. Open the Chart and Find the Indicators Tab
The first step is to open the chart for the cryptocurrency you want to analyze. After you have opened the chart, go to the top of your screen where the “Indicators” button is normally displayed. This tab allows you to add different technical analysis tools to your chart.
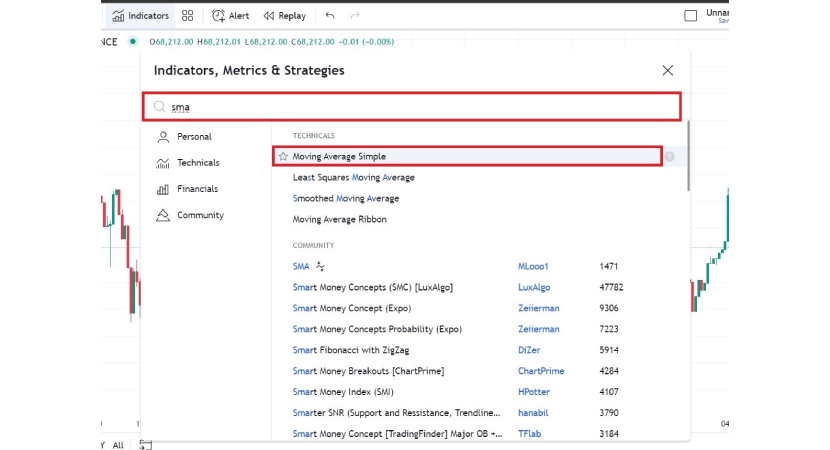
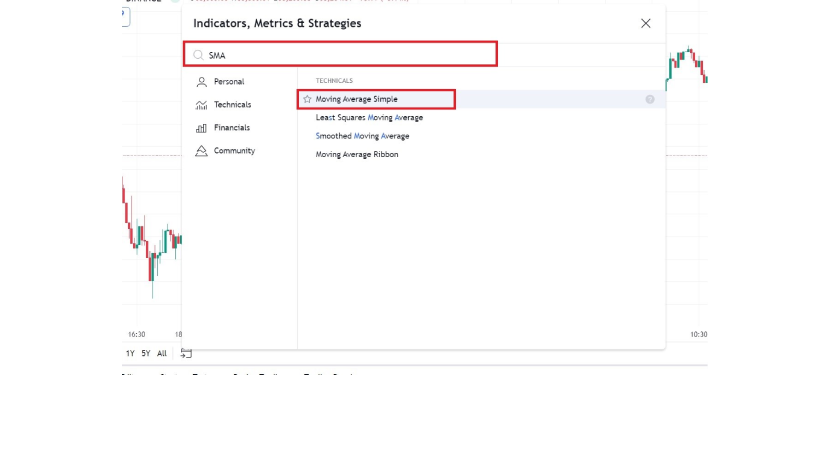
2. Search for "Simple Moving Average" and Add It Twice
You will see a search bar after you've entered the Indicators tab. Type SMA and select it. Add the simple moving average twice since you will require two different Simple Moving Averages.
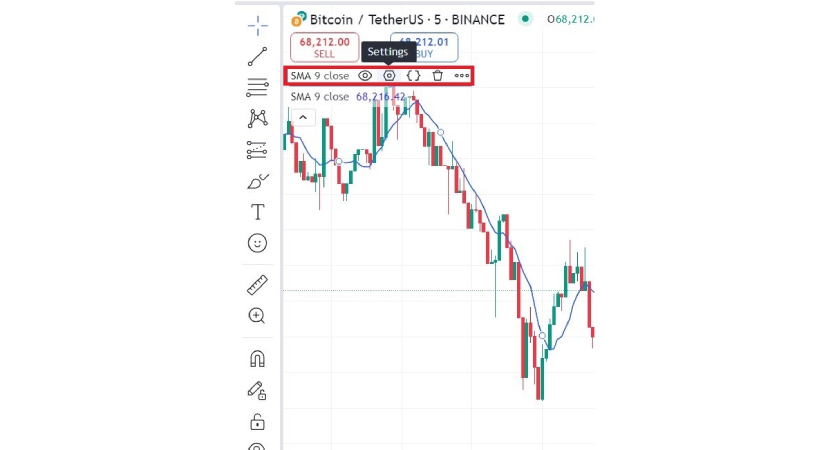
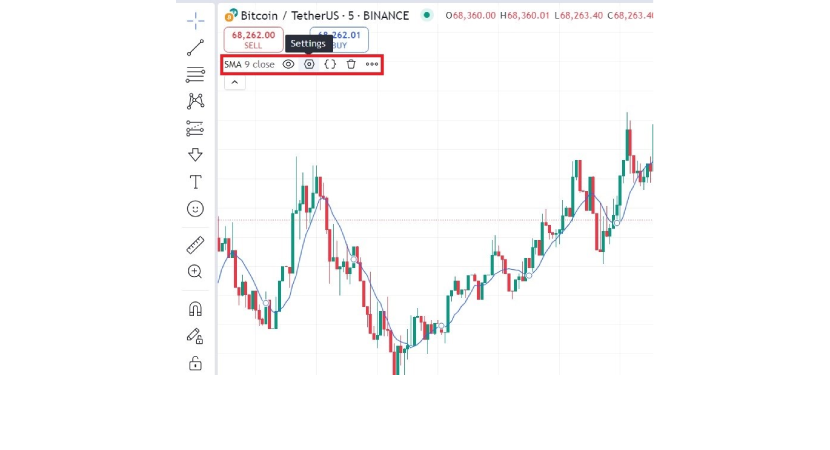
3. Access the Settings for The First Simple Moving Average
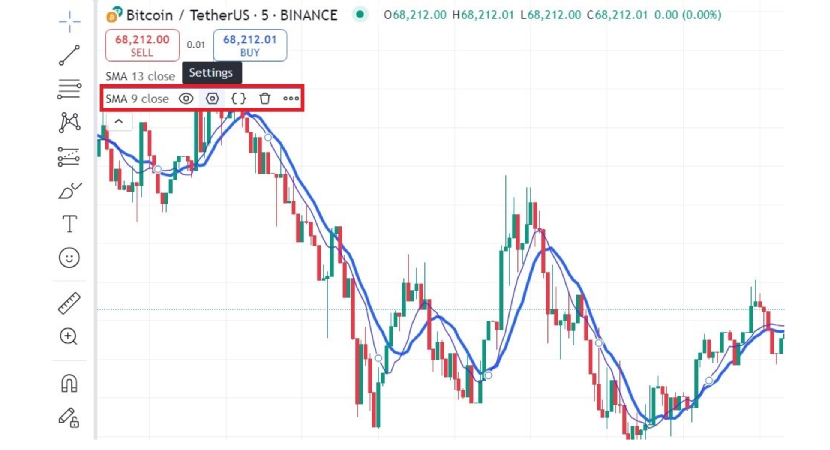
You need to customize these moving averages using the settings. You can find the setting by choosing the SMA text at the top left of your chart and pressing the setting button, which is represented by a cog icon.
4. Set the First Moving Average to 13
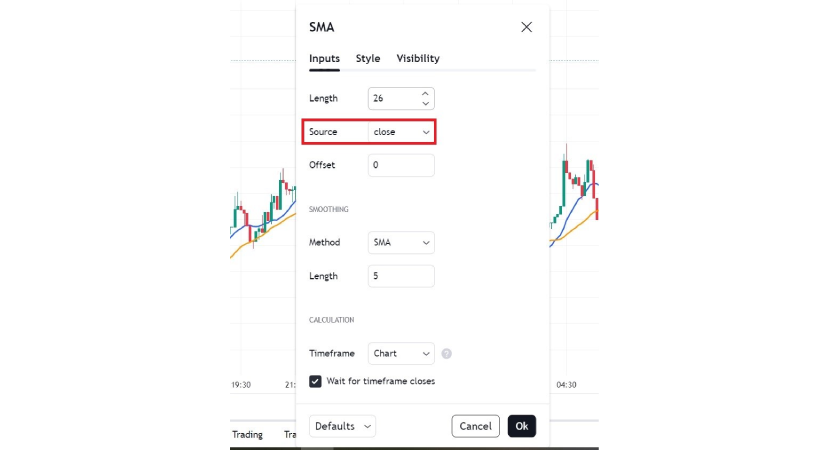
Go to the inputs menu.
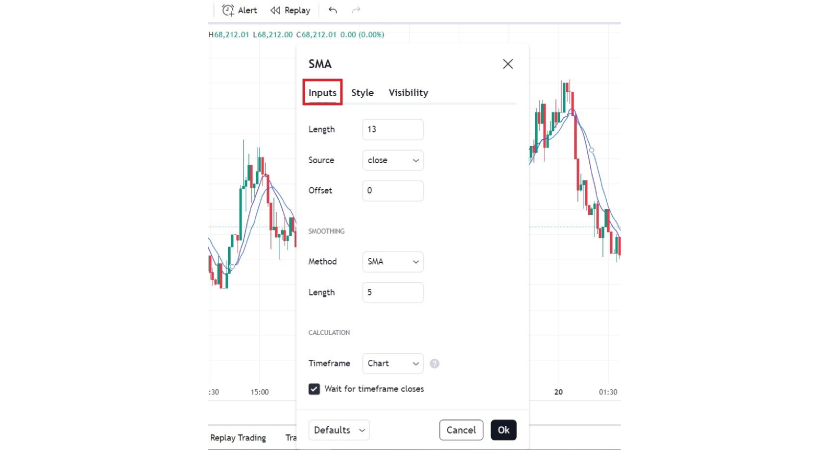
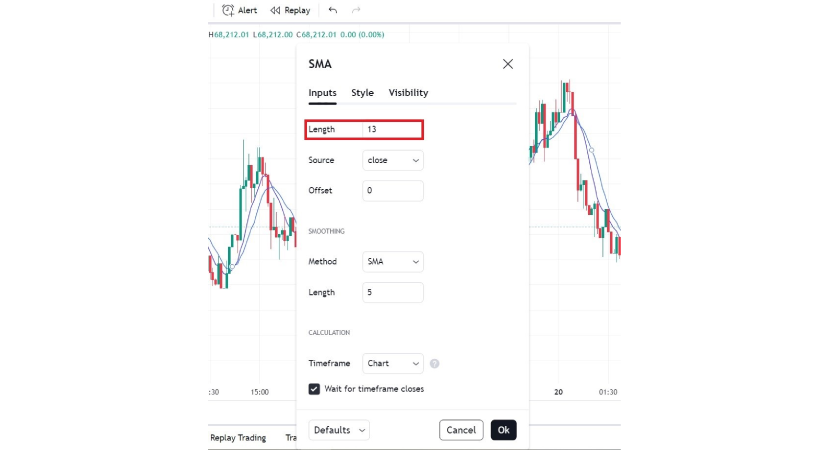
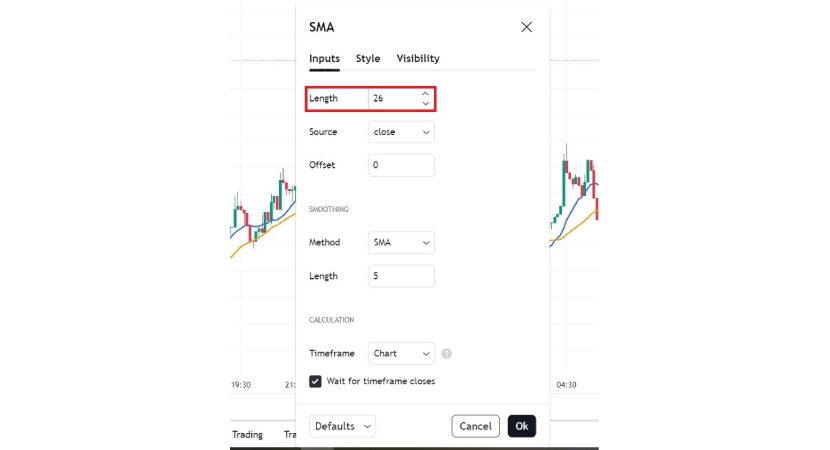
Adjust the length to 13 for the first moving average.
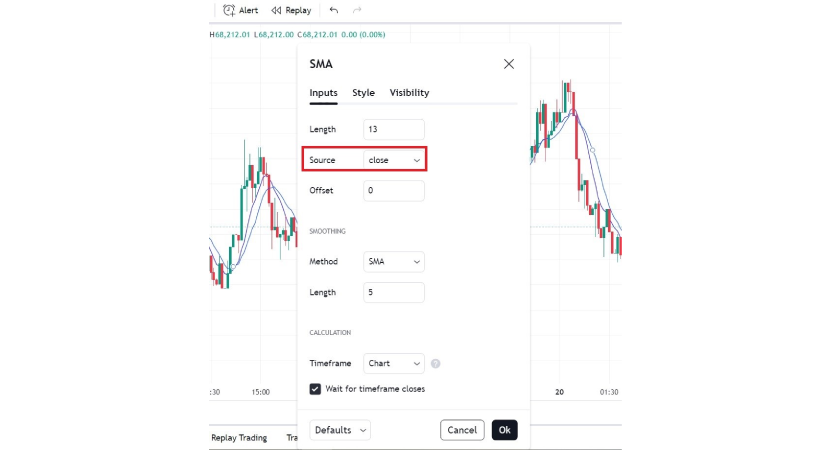
You can also change the source for the prices used in the SMA. In this guide, we use the closing price.
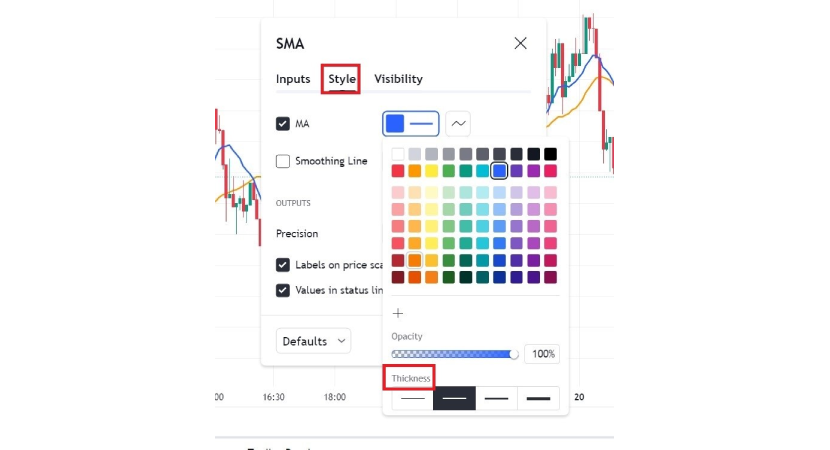
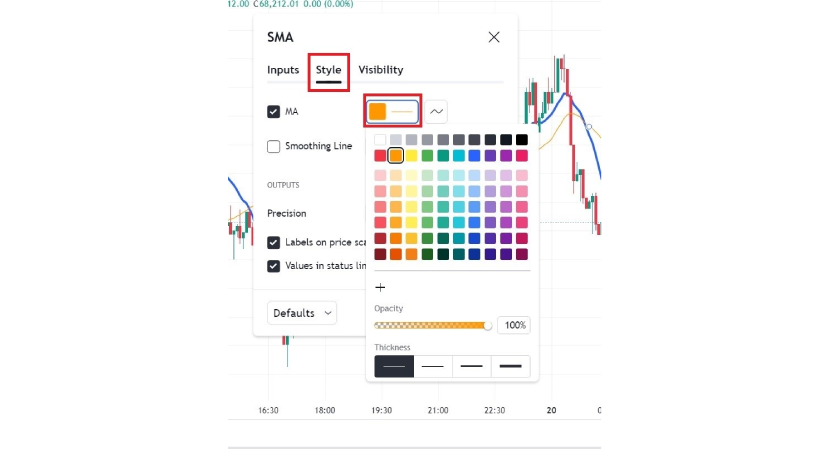
Press the style button. On this page, you can change the color of your SMA line. Our 13-day SMA is visible as a blue line.
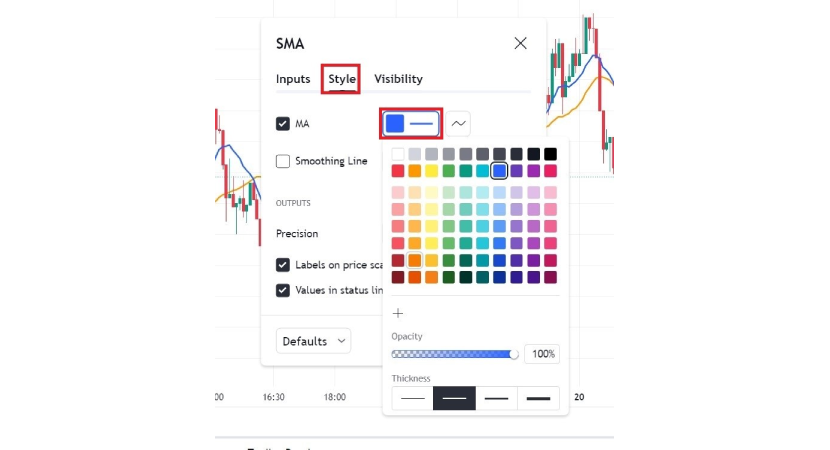
You can also change the thickness of the line to make it more visible.
5. Set the Second Moving Average to 26
Move to the second SMA and choose the lower SMA text in the top left of your chart.
Choose Inputs.
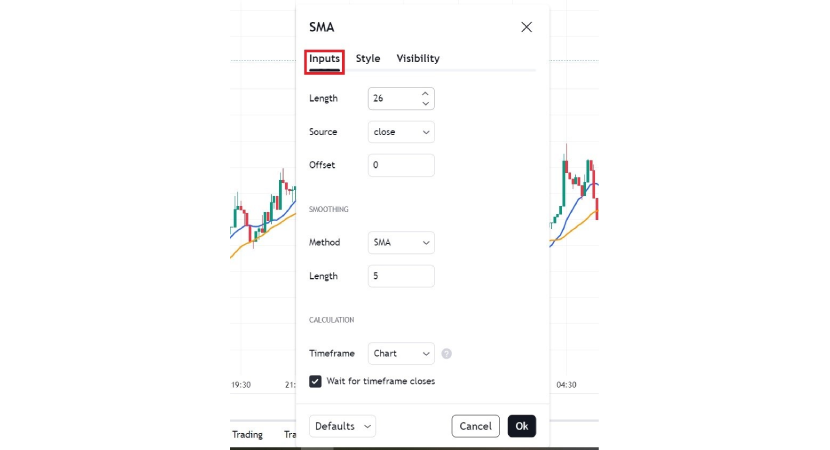
Adjust the length of this SMA to 26.
You can change the source of data, but we will use the close option in this guide.
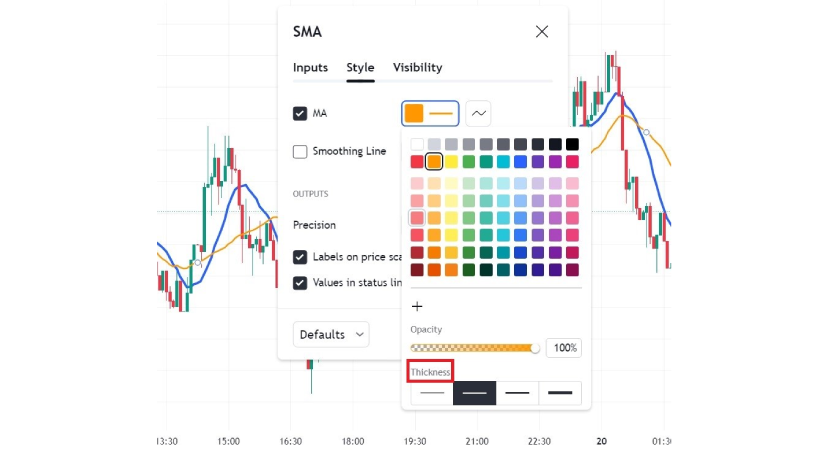
Press the Style button. You can make this line a different color to make reading and analyzing crossovers easier. In this guide, our 26 SMA is shown by the orange line.
You can also change the thickness of the line and choose from 4 options.
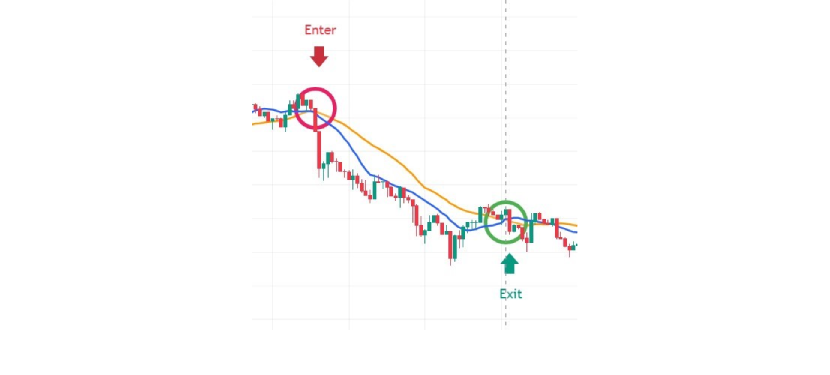
6. Watch for an Upward Crossover (Buy Signal)
If the 13-period SMA crosses from below and goes above the 26-period SMA, this indicates an upward trend, signaling a potential buying opportunity. This is a sign that the market could go up. The next downward crossover might start a reversal and a downtrend. So, to avoid losses in case of a reversal, use the next downward crossover as an exit point for your buy trade.
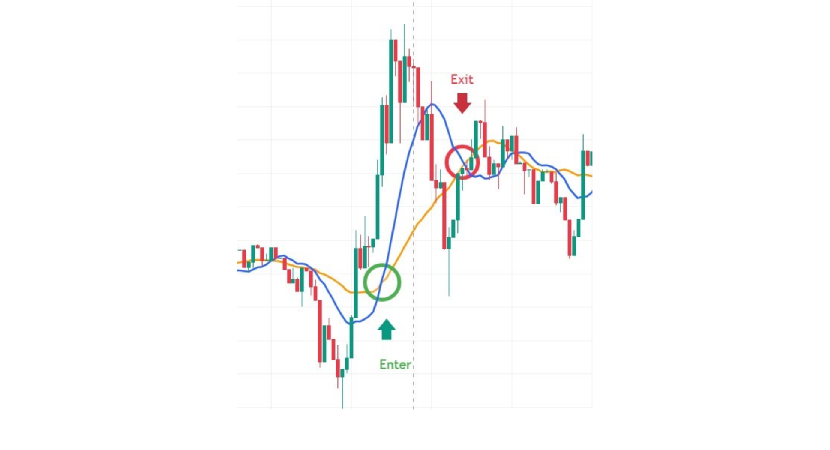
7. Watch for a Downward Crossover (Sell or Exit Signal)
If the 13-period SMA crosses from above and goes under the 26-period SMA, this suggests a downtrend, signaling a potential sell or exit opportunity. This indicates the market may be losing upward momentum and gaining downward momentum. If you have entered a sell trade, you also need to watch for the next upward crossover, as it can signal a reversal, which is the appropriate time to exit a sell trade.
This method is one of the easiest ways to follow market trends and increase your chances of entering trades at the right time. The strategy for implementing these two Simple Moving Averages is easy to understand and set up, making it a favorable choice for new traders who use technical analysis in crypto trading.
Trade Using One Simple Moving Average (SMA)
You also have the option to use a simple moving average (SMA) to identify trends and make trading decisions. To explain how to use moving averages in crypto trading using this strategy, you smooth out short-term price changes and make the overall trend easier to observe. The single Simple Moving Average makes tracking the price of a cryptocurrency easier.
1. Finding the Indicators Section
Open your preferred cryptocurrency chart. Find the Indicators section, usually at the top or side of the page. This is where you'll add technical indicators like the SMA.
2. Searching for and Choosing the Simple Moving Average (SMA)
Go to the Indicators tab, then type "Simple Moving Average" or "SMA" in the search bar. Choose Simple Moving Average to add it to your chart.
3. Finding and Accessing the SMA Settings
Open the indicator settings. You can find it by choosing the SMA text located in the top left of your chart.
4. Set the Period of the Simple Moving Average
To use a single SMA to trade, you need to establish the period of your Simple Moving Average. A commonly used setting is the 20-period SMA, which averages the price of a cryptocurrency over its last 20 days. This moving average provides a solid indication of the asset's short-term trend. In the Inputs menu, you can adjust the length of the moving average by changing the numbers in front of Length and typing 20.
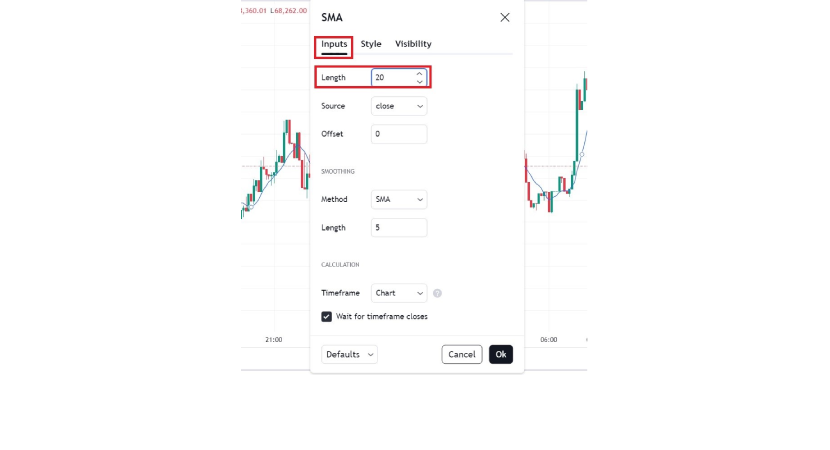
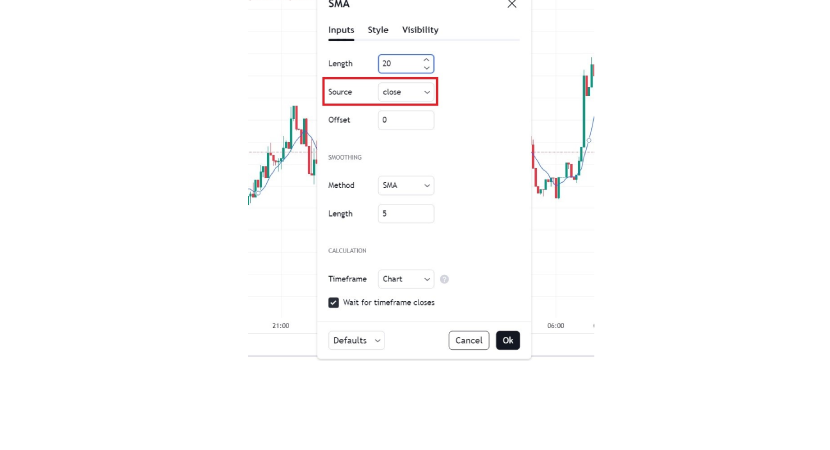
You can also change the source of the price. Here, we have used the closing prices.
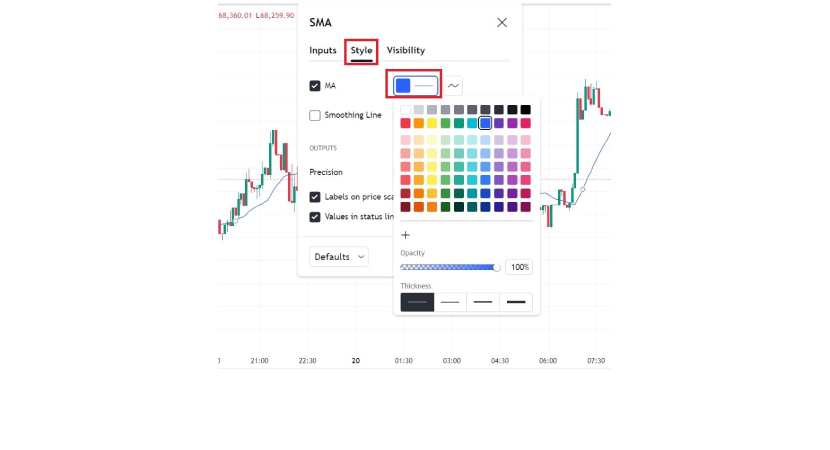
You can also customize the color of the SMA line on the Style page. We are using blue for our SMA line.
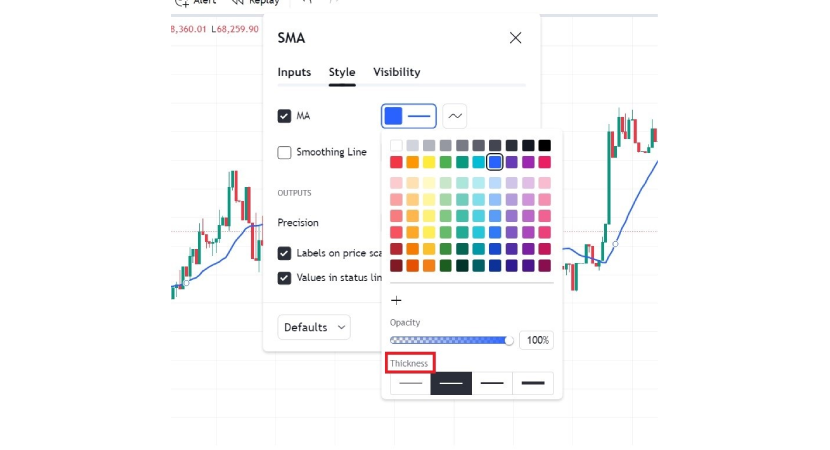
You can also change the thickness of the line in the Style page.
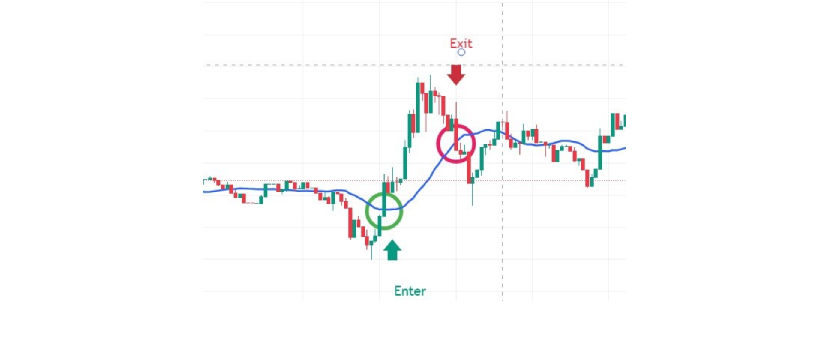
5. Trade Setup: Buy Trade
After the 20-period SMA is added to your chart, the next step is to look for a buying opportunity. A rule of thumb is that when the price moves above the 20-period SMA, it could signal a buy trade. This indicates that the cryptocurrency is trending upward, with market sentiment likely turning bullish. To exit your buy trade at a point in the chart where the price breaks the SMA line and keeps going down.
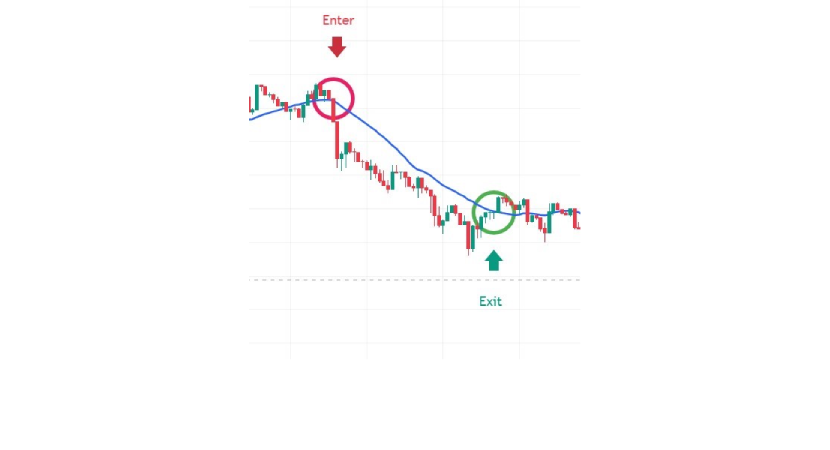
6. Trade Setup: Sell Trade
If the cryptocurrency price falls below the 20-period SMA, it may indicate an ongoing bearish trend and could be a signal to enter a sell trade. You can also exit your sell trade when the price breaks through the SMA line and keeps going above it.
Riding the Trend
This approach allows traders to stay with the trend for longer because as the price remains above the 20-period SMA, traders know the uptrend is going strong.
Risk Management
To succeed, it’s essential to incorporate risk management strategies. When entering a buy trade, you can place a stop-loss order just below the SMA to guard your capital against sudden reversals. This gives you the ability to minimize your losses if the price unexpectedly moves in the opposite direction of your prediction.
Adopting a single simple moving average is an easy method for executing trades in the cryptocurrency market. Traders can identify trends and make optimal entry and exit decisions based on the price's relation to the SMA. Moreover, this straightforward approach helps traders avoid emotional decisions and focus on objective price data.
Different Types of Moving Averages and Their Uses
We discussed Simple Moving Average (SMA) as one of the most fundamental and simplest types of technical tools. But there are many Moving averages that can be used for various strategies depending on traders’ aims. At PlasBit, We have researched various types of moving averages more commonly used in cryptocurrency trading to provide you with an easy-to-understand explanation for each one.
1. Volume-Weighted Moving Average (VWMA)
The Volume-Weighted Moving Average (VWMA) is a price indicator that includes trading volumes in its calculation. It provides a more realistic measure of market sentiment by increasing the weight of periods where trading volume is high.
What is it used for?
It is typically used by traders to check the price trends with volume confirmation. If the VWMA is in line with or close to price movement, it indicates a powerful trend since volume supports that trend. Traders use this tool to assess whether the trend is strong and to minimize false signals.
2. Smoothed Moving Average (SMMA)
The Smoothed Moving Average (SMMA) is a type of moving average that places equal weight on all data points over a longer time period. Resulting in a line that is considerably smoother than that generated by either an SMA or EMA. SMMA flattens fluctuations even more.
What is it used for?
The SMMA is a good tool for traders wanting to follow the long-term trend and avoid overreacting to volatile price movements. It’s generally used in markets where prices follow long-term trends but also experience regular fluctuations. In the cryptocurrency market, swings in price can cause traders to overreact. SMMA reduces these overreactions by smoothing out these movements and providing additional insight.
3. Hull Moving Average (HMA)
The Hull Moving Average (HMA) is designed to eliminate lag. It uses a weighted average formula and takes into account the square root of the period to ensure that the moving averages respond more quickly. This results in a quick, responsive average price while maintaining smoothness.
What is it used for?
Traders prefer HMA over traditional SMAs and EMAs because it provides a fast-moving average without lag. It offers a balance between quick signals and reduced fluctuations. This makes it popular among trend-following traders as it’s well-suited for capturing short-term price trends in volatile markets like cryptocurrency.
4. Exponential Moving Average (EMA)
Exponential Moving Averages (EMA) give more strength to recent price data. Although the calculation is a bit more complex than SMA, the EMA responds faster to recent price changes and is more sensitive to short-term movements.
What is it used for?
The EMA is especially effective for traders who wish to respond instantly to trends. It is commonly used in momentum trading strategies, where fast response times are crucial. Crypto Day traders often prefer EMA because they can make short trades based on price movements faster than the traditional SMA.
5. Triangular Moving Average (TMA)
The Triangular Moving Average (TMA) gives more weight to middle-range prices. This makes it less volatile than the SMA or EMA. It is also calculated as the average of another moving average, adding an additional level of smoothing.
What is it used for?
The TMA eliminates short-term noise and focuses on the main trend, so it’s used when analyzing long-term trends. It is not ideal for short-term trades as it might react slowly to recent price movements due to its increased smoothing.
6. Weighted Moving Average (WMA)
The Weighted Moving Average (WMA) places greater weighting on more recent price data than past prices. It is based on a linear transformation of prices. Meaning it assigns a weight to each period, placing greater importance on the most recent price data.
What is it used for?
Traders using the WMA want even faster reactions to price changes than the EMA provides. WMAs are typically used in high-frequency trading, scalping, or day trading, as small price movements can significantly impact trade profitability.
7. Adaptive Moving Average (AMA)
An Adaptive Moving Average (AMA) changes its sensitivity in response to market conditions. It smooths out price data more when volatility spikes, causing the line to be less reactive to small fluctuations. It becomes more sensitive in low volatility, allowing for quicker reactions to market adjustments.
What is it used for?
The AMA is perfect for changing volatile market conditions as it adapts to the scale of price changes. Traders use this tool to get a clearer view of the trend both when the market is experiencing volatile and stable conditions.
8. Geometric Moving Average (GMA)
The Geometric Moving Average (GMA) uses an exponential mean, making it less affected by extreme price values than standard arithmetic averaging. It provides unique smoothing by reducing the effects of outliers in the data.
What is it used for?
The GMA is valuable to traders who seek a well-rounded smoothing approach. Especially when dealing with data that has spikes. It is used in markets where volatile price movements need to have less impact on overall trend analysis.
9. Double Exponential Moving Average (DEMA)
A variation of the Exponential Moving Average (EMA) is called the Double Exponential Moving Average (DEMA). DEMA reacts to price changes faster and eliminates lag by using the EMA formula twice.
What is it used for?
Short-term traders find DEMA useful as it offers a fast-moving indicator that captures price trends quicker than a regular EMA. This quality is especially useful in fluctuating markets because even a small delay in spotting trends can affect trading success.
10. Triple Exponential Moving Average (TEMA)
The triple exponential moving average (TEMA) applies the EMA formula three times. Making it an even more responsive version of the DEMA.
What is it used for?
TEMA is perfect for super-fast trading environments, as traders must respond to trend changes almost instantly. TEMA makes it possible for traders to move with the rapid price changes in extremely volatile markets like cryptocurrency by keeping lag at a minimum.
11. Arnaud Legoux Moving Average (ALMA)
Arnaud Legoux Moving Average (ALMA) is a type of moving average that uses a Gaussian distribution for refining the data. It makes the noise less and gives the middle-range prices more weight. It also decreases the significance of outliers.
What is it used for?
The ALMA is great for trend-following strategies as it allows you to catch quick trend changes. Its smoothing method is unique and useful in markets with inconsistent price swings.
12. Jurik Moving Average (JMA)
The Jurik moving average (JMA) is a proprietary moving average designed to minimize lag while maximizing smoothness. It is widely regarded as one of the most efficient moving averages due to its advanced smoothing techniques.
What is it used for?
The method is also used in algorithmic trading and other advanced strategies that require quick execution times and precision.
13. Guppy Multiple Moving Average (GMMA)
The Guppy Multiple Moving Average (GMMA) is a special form of calculation that uses many sets of Exponential Moving Averages (EMAs). There are a total of 12 EMAs. Half focused on short-term periods, and the other half focused on long-term trends.
What is it used for?
GMMA is useful for letting you know if short-term and long-term trends are in sync or diverging. As when the two sets of moving averages get close together, it suggests that a trend is on its way.
14. Fibonacci Moving Average (FMA)
This moving average is calculated based on the periods set by Fibonacci numbers. This creates a natural rhythm to the indicator, as Fibonacci numbers are believed by many people to have importance and meaning in financial markets.
What is it used for?
The FMA is mostly used in trend-following strategies by traders who believe that the Fibonacci retracements and extensions have a great impact. It is commonly used in combination with other Fibonacci tools to find potential support and resistance levels during trending markets.
Choosing the Right Moving Average
There are several moving averages to choose from, and the right one for you will depend on your style of trading, the market that you trade in, as well as what exactly you want to achieve with them. To understand how to use moving average in crypto trading, you need to know different types of moving averages have different advantages and disadvantages.
Short-Term Trading
Those who practice short-term positions, such as scalping crypto or day trading, are generally more focused on responding rapidly to price activity. Short-term traders are more interested in moving averages that react quickly to new information. Here are the top moving averages for short-term traders.
- Exponential Moving Average (EMA)
- Weighted Moving Average (WMA)
- Hull Moving Average (HMA)
- Double Exponential Moving Average (DEMA)
- Triple Exponential Moving Average (TEMA)
Medium-Term Trading
These traders hope to exploit medium-term trends and will generally hold positions for days to weeks at a time. This approach uses moving averages that are not too smooth but also not sensitive enough to cause confusion. Smoothing features of the moving averages in the list below do not remove too much data but provide a well-balanced view, capturing most of the market trends without being overly influenced by short-term noise.
- Simple Moving Average (SMA)
- Adaptive Moving Average (AMA)
Long-Term Trading
Investors or traders who take a long-term approach try to find and ride major market trends without getting confused by smaller changes in price. Building on long-term strategies requires moving averages to look at large amounts of data over a long period of time. Moving averages in the list below allow long-term traders and investors to concentrate on broader trends rather than getting lost in day-to-day market fluctuation.
- Simple Moving Average (SMA)
- Smoothed Moving Average (SMMA)
- Triangular Moving Average (TMA)
Conclusion
In this PlasBit article, we took into account multiple moving average types, from simple (SMA) to more advanced ones, such as adaptive (AMA) and triple exponential (TEMA). We also gave you tips on how to use moving average strategies. Whether you are a short-term trader or long-term investor, understanding these principles is really important because moving averages form the foundation of technical analysis. These tools can give traders a serious edge in navigating the volatile cryptocurrency markets.
Another key takeaway is that these indicators should not be viewed as the only variable for making trading decisions. Utilizing various indicators together and volume-weighted indicators provides superior signals and gives a more in-depth look into the behind market movements. This multi-tool approach helps traders filter out noise and false signals while keeping the overall momentum of the market in view.
Always remember that moving averages and other technical indicators are only one piece of trading. Trading is not easy, and you will need to have these tools along with strong discipline, emotional control, and good money management to be successful. As you continue to learn new strategies and apply them, you can gradually find out what works best for your trading style.