
Momentum trading in crypto is like surfing the waves of market sentiment, where traders ride trends by entering positions on assets that are gaining price strength and exiting before the tide turns. The core idea of the crypto momentum trading strategy is to find out what is the current trend and ride on its momentum, finding the entry point using momentum technical indicators such as simple moving averages and RSI that factor in what trend we are in and its strength. The perfect scenario is to buy when the prices start to rise and sell when the trend momentum weakens and turns into a downtrend. The Relative Strength Index (RSI), a technical indicator, measures the speed and magnitude of the price change to identify overbought or oversold conditions. Momentum is created and influenced by market psychology, macroeconomic news, or social media hype.
Once a trend becomes clear, the real difficulty is deciding when to go in and out of the market. This is where tools like the Relative Strength Index (RSI) are used. The RSI shows overbought or oversold conditions of a cryptocurrency, which are essentially peaks or bottoms in its price. These tools allow traders to seek out the best times to enter and exit trades in order to capitalize as much as possible when a trend is growing and reduce exposure before it reverses. In the volatile crypto market, this distinction between entry and exit is what enables traders to successfully use a momentum trading strategy.
In this PlasBit article, we take a closer look at the crypto momentum trading strategy. We also touch on trend analysis, strength estimation, trade execution, and risk management. These are important guidelines for spotting and taking advantage of market trends. Learning about these steps is necessary for those who want to start using this strategy and want to refresh their knowledge of this method.
Comprehensive Overview of the Crypto Momentum Trading Strategy
You seek to make a profit with a momentum trading strategy simply by going in the direction that prices have been headed. This concept relies on identifying price moves early and riding them out until signs might show they are over. Now, let us elaborate further on how it works.
Important Principles of Momentum Trading
Psychology-Driven
Momentum trading depends on market psychology and investor behavior. When prices go up, more and more people start buying in, creating a cycle that feeds on itself. This behavior, referred to as herding behavior, is one of the main drivers of momentum. This can help prices continue to rise as a wave of new traders rush to positions because they see others making money. This is a key human behavior that all momentum traders must understand.
Volatility as a Double-Edged Sword
Price movement is stronger in volatile markets, and this greater price change allows for greater profit with momentum trading strategy. So, greater volatility equals greater profit opportunities however, this volatility is also a major concern. Market reversals can happen very fast leading to major losses in minutes or even seconds.
Time Frames Matter
You can use momentum trading on any time frame, from short-term day trading to higher timeframe longer-term positions. Day traders will focus on minute-by-minute price changes, while swing traders may take a position for days or weeks. The time frame a trader chooses depends on their goals, risk tolerance, and the volatility of the asset or market on which they trade.
Momentum Crashes
There are certain risks that you need to look out for when using momentum trading strategy, such as the presence of momentum crashes, which represent a sudden and severe drawback in stock prices. A rising asset that suddenly declines quickly can trap momentum traders who have successfully entered on the high side and are not ready for the downturn. Causing many to lose substantial amounts. Many see these reversals as a reaction to changing market sentiment or unpredictable news.
Sector-Specific Momentum
Momentum trading strategy does not only involve individual stocks; whole sectors can show strong momentum, too. In those situations, traders can trade specific sectors, such as technology, energy, or healthcare, that have market-wide catalysts driving trends within their industries. By focusing on the momentum of an entire sector, traders are capable of spreading risk and profiting from longer-lasting trends.
Momentum with Fundamentals
Although momentum trading is considered a technical strategy, some traders combine fundamental analysis to increase their probability of success. The chances of momentum persisting on an asset increase as traders buy into assets that are supported by improving earnings, good news, or some other fundamental catalyst. The technical momentum indicators combined with fundamental analysis assistance minimize the risk of instant reversals.
Risk Management
This is about not keeping all your eggs in one basket. One way to do so is using stop-losses to reduce losses and determining how much capital you are willing to risk on any given trade. Having a good risk management plan means that one terrible trade can never wipe out your entire trading funds.
How Momentum Trading Predicts Price Changes
The momentum trading strategy does not predict specific price changes but assumes that current trends are expected to remain in the same direction for some time. It uses metrics like the strength and direction of these trends to predict what could happen next. Here are some elements that traders use to make such educated guesses.
Market Conditions
This is an extremely useful feature if you operate in a volatile market like cryptocurrency. However, it will yield fewer results if the market is not volatile enough and does not have plenty of trends.
Entry and Exit points
If the price has just experienced a short-term pullback while moving up traders often that the upward trend is going to continue, and make that trade, riding it higher to capitalize on the trend. Also, they usually use an exit plan, like a trailing stop-loss that moves with the price, to help lock in gains before a trend shift.
Backtesting
Testing your strategy with historical market data can help refine it and visualize how it would have performed. Using this method, you can gain data of the win-or-lose frequency of your trades and how to adjust the strategy for improvement.
Continuous Learning
New technologies, coins, and regulations are always in development, and the market moves with speed. Successful traders recognize that they must constantly be learning and evolving with the ever-changing market conditions.
When you understand these elements behind the crypto momentum trading strategy, it will help you make more informed decisions and may lead to better trading results.
When to open Trades and When to Take Profits
This guide will show you how to pinpoint the correct signals to enter trades and, when is the time to take profits.
Identifying the Right Time to Enter a Trade
Spotting the Trend
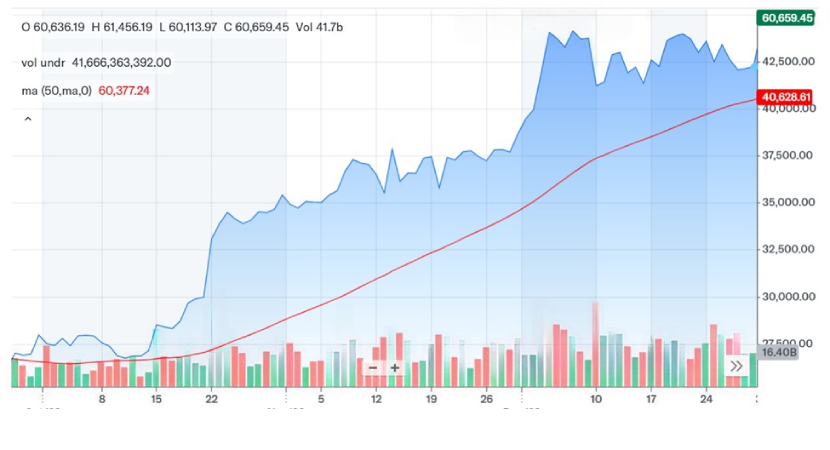
If prices continuously rise, it's an uptrend, and if they continually fall, it's a downtrend. A simple tool like a moving average can help with this. You can look at charts where the moving average line shows the price changes over a period, like the last 30 or 50 days, to determine the price direction.
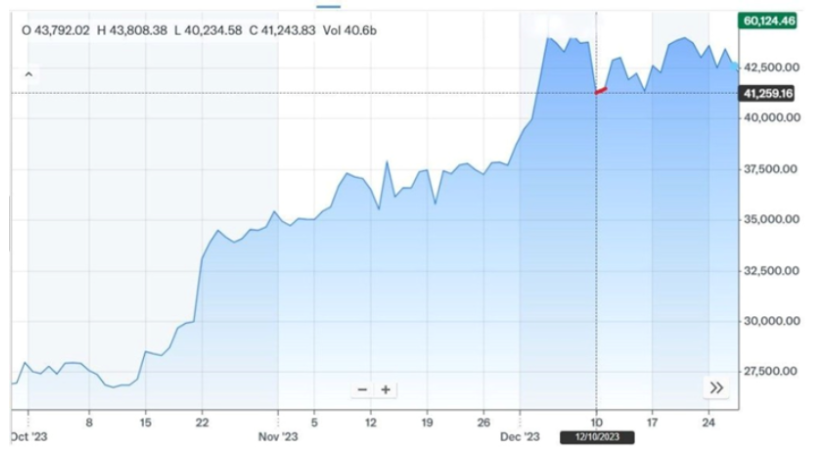
To give an example you can see that the moving average represented with the red line shows an uptrend in the price of Bitcoin between 10/15/2023 to 12/30/2023.
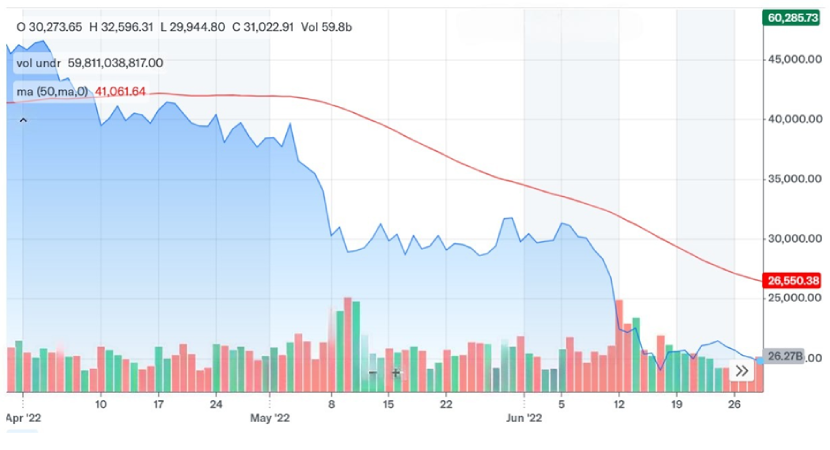
And in the chart below, you can see a downtrend in the price of Bitcoin between 5/8/2022 to 6/30/2022
Confirming the Trend
Check how strong the potential trend is with an indicator like the Relative Strength Index (RSI) when you spot one. If the RSI is over 70, it might be overbought meaning, too many people have bought it, so it might drop. If it’s 30 or less, it may be oversold where too many have sold, and it could rise. Ideally, for momentum trading, you want to enter as the RSI moves away from these extremes toward the middle, confirming a strong trend likely to continue.
For example, in the Bitcoin price chart below, you can see the RSI represented by the black line shows that when the RSI gets close to 20, often you can expect a rise in price in the future days.
.webp)
Wait for a Pullback
If the market is headed in an uptrend, purchase the dip. This is called a pullback. It's like having a small window of opportunity to buy at a discount during a sale in an otherwise expensive market. When the price starts rising again after the pullback, that's your signal to enter the trade.
For instance, in the uptrend chart you saw before, there are several points where the Bitcoin price largely decreases but starts increasing again the next day. One example of a pullback happened on 12/10/2023
Deciding When to Take Profit
Setting a Target
Know how much return you aim to gain from the trade. One way traders do this is by using the levels of recent price highs in the case of an uptrend or lows in the case of a downtrend to set targets for their stop limits.
Using a Trailing Stop-Loss
A trailing stop-loss moves up as prices rise in an uptrend or down as they fall in a downtrend. It secures profits by automatically selling when the price drops a set percentage from its peak. For example, with a 5% trailing stop, if your crypto rises by 20%, the stop-loss will trigger when the price falls into 15%, securing a 15% profit.
Additional Tips
Volume Matters
We at PlasBit suggest that you always check the price trend along with the trading volume because more volume means that fresh money is supporting the trend direction, making the trend more reliable.
Stay Updated
Watch for news and global events, which can emerge suddenly and reverse trends just as quickly, impacting your trades.
Practice Makes Perfect
If you are new to trading, practice these strategies with a demo account or paper trade beforehand. This allows you to experiment with the strategies and see how they work without the risk of losing real money.
Follow these tips so you can better execute the momentum trading strategy and always remember that no strategy guarantees returns all the time, so never trade with money you cannot afford to lose.
Technical Tools Used in Crypto Momentum Trading Strategy
Momentum trading strategy involves utilizing numerous technical tools to discover market trends and capitalize on them. Here are examples of how some of the major tools are used:
Moving Averages (MAs)
Moving averages are used to filter price data over a period of time and determine the direction of a trend. Here are the two main types.
Simple Moving Average (SMA)
This is the price average over a period of time, equally weighing all prices during that period. A 20-day SMA, for example, adds up the last 20 closing prices and divides by 20. This method allows traders to see the overall trend direction by smoothing out day-to-day price changes. It is useful for identifying long-term trends but not very useful for recent price changes happening in a short period of time.
Exponential Moving Average (EMA)
The EMA places more emphasis on recent prices, making it more reactive to new information. This provides a significant advantage in fast-moving markets, where recent price changes are the strongest indicator of future direction. EMAs are calculated by applying a percentage of today's closing price to yesterday's EMA value. Its responsiveness to short-term movements makes it a favorite among traders managing trades proactively.
Relative Strength Index (RSI)
The RSI is a momentum oscillator that measures the speed and change of price movements. It moves between 0 to 100. Usually, the market is overbought if the RSI is above 70 and oversold if it's below 30. It is important that momentum strategy traders use the RSI divergence tool to search for possible turning points in which the RSI is diverging from price movement or where prices are making new highs and lows without indication.
MACD (Moving Average Convergence Divergence)
A powerful momentum indicator that identifies trend change and confirms the ongoing trend. The MACD stands for Moving Average Convergence Divergence and comprises two moving averages, the MACD line (usually calculated by finding the difference between the 12-day EMA and the 26-day EMA) and a signal line (calculated using the 9-day EMA of the MACD line). It is a sign to buy when the MACD line crosses above the signal line, which means that momentum is going to continue to build, and a sign to sell when the MACD line crosses below the signal line, indicating that momentum is starting to dwindle. This is useful when trying to find the start and potential end of a bullish or bearish trend.
On-Balance Volume (OBV)
OBV is a very simple yet powerful indicator that uses volume flow to predict changes in stock price. The concept is volume precedes price movement, which is key for momentum traders like you. On the days when prices rise, OBV would add volume, and on the days prices move lower, OBV would subtract volume. An increase in OBV would suggest that there are more buyers and the uptrend would continue. On the other hand, when OBV is going down, that is a sign that sellers are higher in number, and it is likely to have a downtrend market. This tool allows traders to measure the strength of moves in price and develop buy and sell signals around the momentum of an asset.
Volume Price Trend (VPT)
Volume-price trend (VPT) is a price-volume indicator, and it takes into account the balance of supply and demand. It aids in identifying the strength of a trend through volume changes. Rapidly increasing VPT indicates that there is a lot of buying activity in the market, and thus, price may continue to rise. When it goes down, it shows that there is selling pressure, at which point the price may experience a downward trend.
Accumulation/ Distribution Line
This is an indicator that helps to learn whether a cryptocurrency is accumulated or being distributed. If the accumulation/distribution line is trending upward, then that means more of this asset is being bought (accumulation), which means there are going to be some upward price changes. On the other hand, a declining line implies selling (distribution); which tells you that lower prices are in their way. This tool is great for confirming signals that are suggested by other indicators.
Stochastic Oscillator
Stochastic Oscillator is used to determine the momentum of price movements by analyzing the difference between closing prices and a range of prices for a particular period. It gives you a level between 0 to 100 which tells if a particular asset is Overbought or Oversold. Usually, levels above 80 mean the market is overbought, and lower than 20 indicates oversold condition. This tool is perfect for catching reversals before they happen.
Bollinger Bands
You can use these bands as an indicator that adjusts to the market and volatility. It consists of a middle band that acts as a moving average that is placed between two standard deviation lines. They expand with higher volatility and contract when the volatility drops. The use of Bollinger Bands as entry and exit indicators is common, where prices near the upper band represent potential selling points and signal buying points around the lower band.
Fibonacci Retracements
An indicator to spot possible reverse levels. These levels come from the Fibonacci sequence, wherein each number is the sum of the two prior numbers. Fibonacci retracement levels are commonly used as potential support and resistance since the price tends to retrace a predictable portion of a move before continuing in the original direction.
Average True Range (ATR)
ATR works by breaking down the full range of an asset price over a period of time, and finding the market volatility of the asset. The higher the ATR, the more volatile the asset is, and the lower the less. ATR is used by traders to make changes to their trading strategies. For example, if ATR is high, a trader might place wider stops to work with bigger price movements.
Combined, these solutions offer a complete toolkit that cryptocurrency traders can use as a comprehensive strategy to track and leverage market momentum effectively. They not only specify when to enter and exit positions but also how to handle risk by indicating potential changes in trend and providing a perspective on market conditions.

Why the crypto market is suitable for momentum trading?
The cryptocurrency market is ideally suited for momentum trading due to several unique attributes that enhance this trading strategy:
High Volatility
Cryptocurrencies have frequent price swings. The consequence of this high volatility is the movements in price that are strong and often, which are perfect for momentum traders who are looking for such price instabilities to make trend-driven entries trying to ride momentum as long as the current movement is holding or until it starts to show signs of stopping.
24/7 Market Operations
Unlike traditional stock markets, which close daily and on weekends, the crypto market runs 24/7. So traders are able to capture trends as they arise in real-time without waiting for markets to open, and they can respond immediately to the market.
Volume
In the crypto markets, trading volume can be an indicator of momentum. In that sense, that high volumes indicate the strength of a price movement. Because of this, high volume always results in more reliable momentum signals and makes trends easy to follow since high volume typically comes before sustainable price moves.
Market Sentiment and Network Effects
Cryptocurrencies tend to become more valuable as a growing number of people use them and invest in them; this is the so-called network effect. The sentiment in the crypto industry can also shift massively at a moment's notice, leading to rapid and large price swings. Momentum traders capitalize on these transitions by entering trades that reflect the broader market sentiment and riding the wave of buying or selling pressure.
Technical Suitability
Since momentum trading often uses technical analysis, the fact that cryptocurrency markets are particularly responsive to it is essential. Crucial trading tools such as the Relative Strength Index (RSI), Moving Average Convergence Divergence (MACD), and various moving averages indicate whether or not momentum is building up or dying down. This is especially important because these tools give traders signals, when to enter or exit trades.
All of these factors create the ideal environments and tools for momentum traders to capitalize on short-term price movements in the crypto market.
Conclusion: Making the Most of Crypto Market Movements with Momentum Trading
In this PlasBit article, we outlined the technical tools used in the crypto momentum trading strategy and why the cryptocurrency market is especially suitable for this approach. The tools discussed include moving averages, RSI, MACD, OBV, and more, which help traders identify trends, manage risk, and optimize entry and exit points. Additionally, you learned that the crypto market's high volatility, 24/7 operations, significant trading volume, and responsiveness to technical analysis make it an ideal environment for momentum trading. Yet, notice that you need to do your own deep research and find the trading method that aligns with your personality traits and works best for you.
In the cryptocurrency market, momentum trading is about using everything you know about trends in the market to make better trading decisions. Due to the ever-changing nature of the crypto market, it is necessary that traders continue learning and evolving their strategies so as not to fall behind. So, it is important to note that in the highly dynamic cryptocurrency market, traders can find and leverage almost uncountable profitable opportunities as long as they stay informed and ready to act.